
Debt-to-Equity Ratio: Understanding the Meaning, Formula and Interpretation
Updated: 23 Jul 2025 • 4:49 pm
Posted by:

Meaning: The debt-to-equity ratio is a leveraging ratio used in corporate finance to assess the amount of a company’s capital structure funded through debt financing.
What is the Debt-to-Equity Ratio?
The debt-to-equity ratio is one of the most important financial ratios in the investing world, used to gauge the amount of debt a company owes relative to equity capital. The D/E ratio represents the relationship between the debt and equity portion of a company.
The D/E ratio is also known as the leverage ratio because it provides insights into the leverage of listed corporations. Leverage refers to the amount of borrowed money used to finance a business’s operations and, eventually, to enhance revenue.
Debt (or leverage) and equity, along with retained earnings, form the capital structure. Therefore, the debt-to-equity ratio becomes extremely important in analysing how much debt a company takes to finance its operations compared to the equity portion.

What is Debt?
Debt is basically the amount of money borrowed by an individual or a business organisation to fund their daily day-to-day act. Typically, in corporate finance and the stock market, debt is primarily sourced and applied in running a business with the objective of increasing revenues and profits.
Debt also increases the risk of business because there are costs involved in debt financing, such as fixed repayment schedules and interest payments.
What is Equity?
Equity refers to that portion of a company’s capital structure that is funded through equity shares or stocks. Typically, it represents the ownership of various shareholders, such as promoters, individuals, and institutional investors, through stocks or shares.
Unlike debt, equity does not increase the risk element of business because companies are not obliged to repay shareholders’ invested capital.
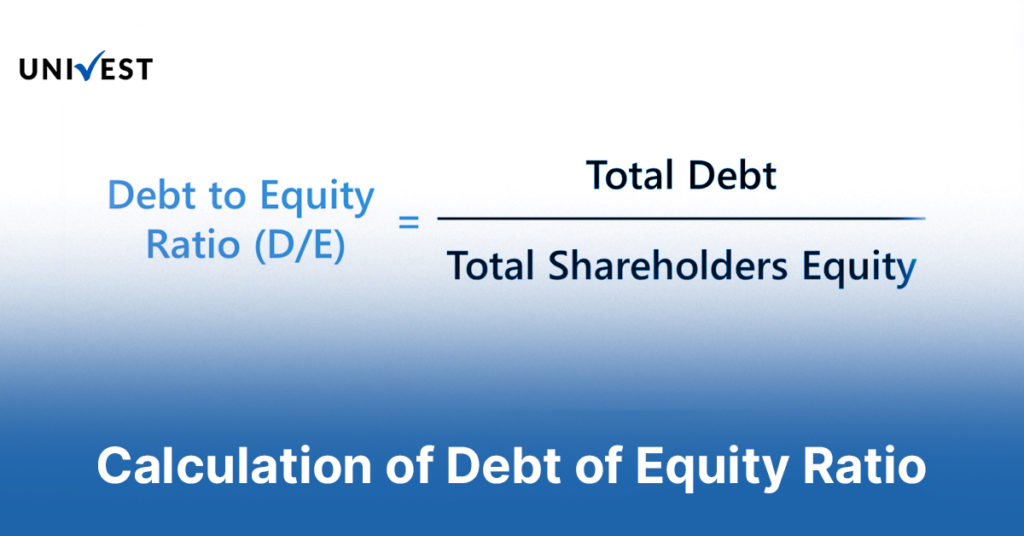
Debt-to-Equity Ratio Formula and Calculation
Debt-to-Equity Formula = Total Liabilities/Total shareholders equity
The debt-to-equity ratio formula consists of two major elements:
Total Liabilities – Total liabilities represent a company’s aggregate value of short and long-term debt. Total liabilities can be found on the balance sheets of listed companies below the assets portion.
Total Shareholder’s Equity – Total shareholder’s equity, also known as a company’s net worth. It refers to the difference between the assets and liabilities. Shareholder’s equity is typically the amount of business that its shareholders own.
To calculate the debt-to-equity ratio, the total liabilities of the business are divided by the total shareholder’s equity (net worth).
Calculation of debt-to-equity ratio
To understand the calculation of the D/E ratio, let us look at an example: suppose a company, ABC Limited, has the following liabilities and assets on its balance sheet.
| Particulars | Values (₹) |
| Total assets | ₹ 75,00,000 |
| Short term borrowings | ₹ 5,00,000 |
| Long term borrowings | ₹ 20,00,000 |
Total Liabilities = Short-term borrowings + Long-term borrowings
= ₹ 5,00,000 + ₹ 20,00,000
= ₹ 25,00,000
Shareholder’s Equity = Total assets – Total Liabilities
= ₹ 75,00,000 – ₹ 25,00,000
= ₹ 50,00,000
D/E ratio = total liabilities/total shareholder’s equity
= ₹ 25,00,000/₹ 50,00,000
= 0.5
Interpretation of Debt-to-Equity Ratio
The value derived from the debt-to-equity ratio formula can be interpreted in many ways depending on the respective D/E ratio.
High D/E ratio
A high debt-to-equity ratio indicates that a company is funding a large portion of its total finances through debt, which increases the business risks. A high D/E ratio indicates the existence of a high amount of borrowings in the capital structure compared to the equity.
Low D/E ratio
Unlike the high debt-to-equity ratio, a low D/E value tells investors that a listed organisation heavily relies on equity to finance its business. The decrease in borrowings of a company reflected in a lower D/E ratio, is an indication of a strong business model and operational efficiency.
Use of Debt-to-Equity Ratio in Stock Market
Various stakeholders of the investing world use the debt-to-equity ratio in various ways. Some of the primary reasons to use the D/E ratio are:
Assessment of the company’s leverage
The debt-to-equity ratio is a crucial metric for analysing a company and assessing the leverage the company has. The D/E ratio assists investors in understanding how much exposure an organisation has in terms of outside payment obligations to its lenders and creditors.
Assessment of business risk
The debt-to-equity ratio is extensively applied to asses teh business risk by analysing a company’s reliance on debt financing. A higher amount of borrowings in the balance sheet reflects risk exposure. Therefore, in many cases, a higher D/E ratio for a particular year or an increasing D/E ratio over a period indicates rising leverage and risk.
Decision making
Like any other financial ratio applied in investment analysis practices for comparing companies in the same industry to finding the best investment opportunity in the stock market.
Limitation of Debt-to-Equity Ratio
The debt-to-equity ratio, even after being such an essential financial ratio in corporate finance, carries certain limitations that can not be ignored while using it.
Misleading interpretation
Variation in a company’s debt-to-equity ratio over a period of time is the result of an increase or decrease in its borrowings. Therefore, it can be challenging to make a conclusive decision based on the D/E ratio because a higher DE ratio may indicate increased leverage, and at the same time, a lower D/E ratio indicates decreased borrowings.
Not applicable for cross-industry analysis
It happens because there is no ideal D/E ratio or accepted benchmark, and it also varies across industries in the stock market. Capital-intensive industries such as manufacturing and mining tend to have higher debt-to-equity ratios because they rely a lot on debt financing. Meanwhile, companies in the tech or service sector have lower D/E ratios.
To successfully apply the debt-to-equity ratio in an optimum manner, it must be used in conjunction with other ratios. Along with the D/E ratio, investors must prefer using the PE ratio, earning ratio, ROE ratio, PB ratio, or operating profit margin.
Conclusion
- The debt-to-equity ratio is a leverage ratio, also known as a gearing ratio, that measures the company’s debt relative to the equity capital.
- It tells investors how much debt the company uses per unit of shareholder’s equity to fund business operations.
- The debt-to-equity ratio is also used to analyse the risk profile of a listed corporation.
- The D/E ratio is calculated by dividing the total liabilities by the shareholder’s equity.
FAQ on Debt-to-Equity Ratio
1. What is the debt-to-equity ratio?
The debt-to-equity ratio is a financial metric that represents the amount of debt taken by a company relative to its equity capital to fund its operation. It reflects the portion of a company’s debt present in its capital structure.
2. What is an ideal D/E ratio in India?
A debt-to-equity ratio below 2.0 or between the range of 1.0 to 1.5 is considered good. However, the DE ratio can vary across industries. Hence,e a ratio of 2.0 can be considered suitable for one industry, and at the same time, it can be considered a red flag for another industry.
3. What is the debt-to-equity ratio formula?
The debt-to-equity ratio formula = Total liabilities/Shareholder’s equity.
Total liabilities refers to the summation of the short and long-term liabilities.
Shareholders equity is calculated by subtracting liabilities from a company’s total assets.
4. Can the D/E ratio value be negative?
Yes, the D/E ratio can give a negative value. This can happen when a company’s total liabilities exceed the total assets, leading to a negative shareholder’s equity.
Read Our Articles on the Best Stocks
Multibagger Penny Stocks for 2025 | Top Multibaggers
Railway Stocks in India to Invest in
Return on Equity – A Comprehensive Guide
Best Mulitbagger Penny Stocks Below 100 Rupees
Aerospace and Defence Stocks in India
Auto Sector Stocks in India to Invest In
Railway Stocks in India to Invest In
Explore Current and Previous IPOs
| Company | Opening Date | Closing Date |
| HP Telecom India Limited | 20th February 2025 | 24th February 2025 |
| Swasth Foodtech India Limited | 20th February 2025 | 24th February 2025 |
| Royalarac Electrodes Limited | 14th February 2025 | 18th February 2025 |
| Tejas Cargo Limited | 14th February 2025 | 18th February 2025 |
| Quality Power Electrics Equipment Limited | 14th February 2025 | 18th February 2025 |
| Shanmuga Hospital Limited | 13th February 2025 | 17th February 2025 |
Univest Screeners
52-Week Low Stocks Today
| Stocks | LTP (₹) | New Low (₹) |
| VBL | ₹469.10 | ₹ 711.55 |
| JIOFIN | ₹ 221.02 | ₹ 744.95 |
| GODREJCP | ₹ 1015.55 | ₹ 292.8 |
| IOB | ₹ 45.18 | ₹ 667.05 |
| CANBK | ₹ 84.65 | ₹ 252.2 |
| BHEL | ₹ 186.57 | ₹ 349.25 |
| COLPAL | ₹ 2450.00 | ₹ 650.35 |
| IRCTC | ₹ 719.20 | ₹ 114.45 |
| PIIND | ₹ 3165.60 | ₹ 470.05 |
| UCOBANK | ₹ 37.40 | ₹ 217.14 |
*Data is updated as of 17th February 2025.
52 Week High Stocks Today
| Stocks | LTP (₹) | New High (₹) |
| AARTIPHARM | 808.90 | 255.76 |
| MPSLTD | 2375.90 | 804.65 |
| TCPLPACK | 3560.60 | 151.00 |
*Data is updated as of 17th February 2025.
Popular Stocks to Consider
Explore Webstories on Univest
- The Impact of Rising Water Scarcity on Irrigation Stocks.
- How Climate Change is Driving Innovation in Agriculture.
- Why AI and Big Data are Boosting Agri-Tech Companies.
- Top Performing Fertiliser Companies in the Indian Market.
- The Role of Sustainable Practices in Shaping Agri Stocks.
- How Rising Rural Income Impacts Agricultural Stock Performance.
Recent Articles

Sundaram Long Term Tax Advantage Fund Series IV vs Bank of India Mid Cap Tax Fund Series 1 Regular Growth: NAV, Returns and Maturity Status Compared
21 July 2026

Sundaram Long Term Tax Advantage Fund Series III vs UTI Series IV: NAV, Returns and Maturity Status Compared
21 July 2026

Sundaram Long Term Tax Advantage Fund Series II vs SBI Series IV: NAV, Returns and Maturity Status Compared
21 July 2026

Sundaram Long Term Tax Advantage Fund Series III vs UTI Series VI: NAV, Returns and Maturity Status Compared
21 July 2026
Note: This blog is for information purpose only. Investments and trading are subject to market risks, read all scheme related documents carefully.
Reviews


Recent Posts
Sundaram Long Term Tax Advantage Fund Series IV vs Bank of India Mid Cap Tax Fund Series 1 Regular Growth: NAV, Returns and Maturity Status Compared
Sundaram Long Term Tax Advantage Fund Series III vs UTI Series IV: NAV, Returns and Maturity Status Compared
Sundaram Long Term Tax Advantage Fund Series II vs SBI Series IV: NAV, Returns and Maturity Status Compared
Sundaram Long Term Tax Advantage Fund Series III vs UTI Series VI: NAV, Returns and Maturity Status Compared
UTI Long Term Advantage Fund Series III vs Sundaram Micro Cap Series III Regular: NAV, Returns and Maturity Status Compared
Popular this week
Sundaram Long Term Tax Advantage Fund Series IV vs Bank of India Mid Cap Tax Fund Series 1 Regular Growth: NAV, Returns and Maturity Status Compared
Sundaram Long Term Tax Advantage Fund Series III vs UTI Series IV: NAV, Returns and Maturity Status Compared
Sundaram Long Term Tax Advantage Fund Series II vs SBI Series IV: NAV, Returns and Maturity Status Compared
Sundaram Long Term Tax Advantage Fund Series III vs UTI Series VI: NAV, Returns and Maturity Status Compared
UTI Long Term Advantage Fund Series III vs Sundaram Micro Cap Series III Regular: NAV, Returns and Maturity Status Compared

Uniresearch Global Pvt Ltd
Research Analyst
SEBI Registration Number — INH000013776
Uniresearch is a subsidiary of Univest Communication Technologies Private Limited
Company Address: Registered Address: Ground Floor, Unitech Commercial Tower 2, Block B, Greenwood City, Unit 1-3, Sector 45, Gurugram, Haryana 122003
Write to us : support@univest.in, compliance@univest.in
Verify on SEBI registry →RESEARCH ANALYST
Get SEBI Registered
advice on the stocks
trending today.
Get 3 FREE Trade Ideas
for Startups Accelerator 2024
Trusted by 1Cr Indians
Awarded No.1 by Economic Times