
P/E Vs P/B Ratio | Everything You Should Know in 2025
Updated: 19 Aug 2025 • 10:04 am
Posted by:

In this article, we will conduct a detailed comparison between P/E and P/B ratios to provide a better understanding of these technical indicators. With the help of this understanding, investors may find it convenient to research the best stocks in the Indian stock market. Both the P/B ratio and the P/E ratio evaluate whether a stock is overvalued or undervalued.
Investors can examine the P/E Ratio (Price to Earnings Ratio) to evaluate the company’s profitability, while the P/B ratio helps investors to assess its asset value. We will also discuss the P/E ratio meaning, the P/E ratio formula, the P/B Ratio meaning, and the P/B ratio formula in detail.
What does the P/E Ratio mean?
P/E Ratio (Price to Earnings Ratio) refers to the ratio of the current price of the company’s share to its Earnings Per Share. The price that investors are willing to pay for each rupee of a company’s earnings. These P/E ratios (Price to Earnings Ratio) are easy to calculate and differentiate from the industry average, which helps to inform investment decisions. The criteria for a high or low ratio are not always conclusive as to whether it’s a good P/E Ratio or not.
P/E Ratio Formula: Know How to Calculate
What is the P/E Ratio Formula?
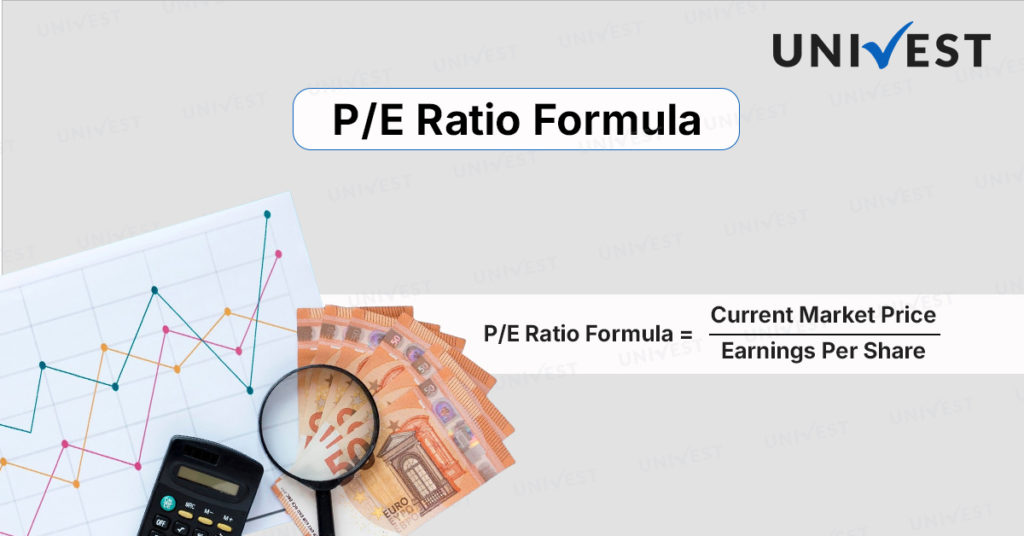
The P/E Ratio Formula is used to calculate the current share market price and Earnings per Share.
P/E Ratio Formula = Current Market Price/Earnings Per Share
- Step 1: Calculate the Current Share Market Price.
- Step 2: Then, calculate EPS(Earnings Per Share) by using the formula (Net Income – Preferred Dividends)/ Weighted Average No of Outstanding Shares.
- Step 3: Divide Step 1 by Step 2.
Price-to-Earnings Ratio Example
Suppose ABC Ltd. has:
Current Market Price( CMP): ₹80
Earnings Per Share( EPS): ₹8
P/E= 80/8= 10
This means they are ready to pay ₹10 for every ₹1 of ABC’s earnings.
If any competitor in the same industry has a P/E (Price to Earnings Ratio) of 20. Then ABC may be undervalued in comparison to its peers.
From the above calculations, it can be said that the P/E Ratio varies
across industries, so the comparison with its peers should be relevant.
It should be compared with the peers having similar business activity.
Then P/E( Price to Earnings Ratio) means whether the stock is undervalued or overvalued. A good P/E Ratio does not always depend on whether it is high or low. The P/E Ratio Formula helps investors calculate the current market share price and EPS.
Interpretation of Good P/E Ratio (Price to Earnings Ratio)
P/E Ratios are most widely used by investors and analysts for reviewing the stock’s relative valuation. Companies that have zero earnings or are losing money don’t have a good P/E Ratio( Price to Earnings Ratio) because there is nothing to put in the denominator. The P/E Ratio is an effective instrument for an investor to evaluate the position of the stock in the supply chain.
For comparing similar companies in the same industry good P/E Ratio is considered the most valuable Ratio. Investors always want to buy financially sound companies that offer a good return on investment (ROI). To select the best stocks, assessing a good P/E Ratio( Price to Earnings Ratio) helps in the research process for all investors.
What do High P/E Ratios and Low P/E Ratios Show?
- High P/E Ratio Meaning: A high P/E Ratio ( Price to Earnings Ratio) indicates that a company’s share price is positively higher relative to its earnings, potentially indicating an overvalued stock. Generally, investors avoid investing in these types of stocks because there may be a risk of speculative bubbles. A good P/E ratio is always moderate; if the P/E Ratio is high, it means investors are paying a premium for the company’s shares, meanwhile the company’s earnings are low.
- Low P/E Ratio Meaning: A low P/E Ratio( Price to Earnings Ratio) indicates that a company’s share price is lower relative to its earnings, which suggests that the stock is undervalued. Low P/E Ratios offer a good buying opportunity to investors. A good P/E Ratio is very useful in making investment decisions. In the situation of a low P/E Ratio, the market may be undervaluing the company, so when investors recognize the true worth of the company, they push the price up.
What is the P/B Ratio?
The good P/B Ratio( Price to Book Ratio) refers to the comparison of the company’s current market value to its book value. Market price is the current stock price of all the outstanding shares. The book value of the company is the net value of all its assets after deducting all Liabilities. It reflects how much shareholders are paying for the net assets of the company. Many investors use the good P/B Ratio to find undervalued stocks. A good P/B Ratio is a forward-looking metric that reflects a company’s Future Cash Flows.
P/B Ratio Formula: Know How to Calculate
What is the P/E Ratio Formula?
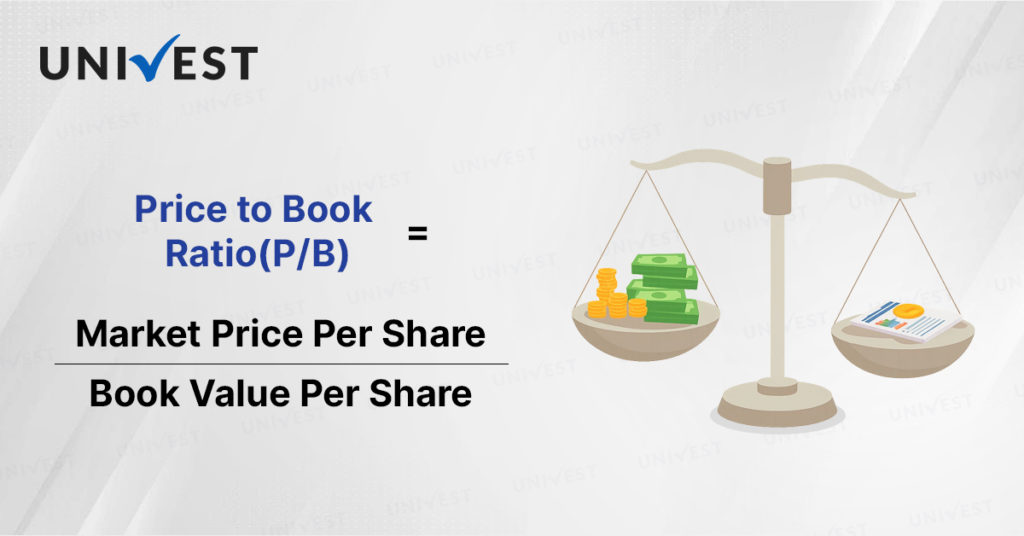
The P/E Ratio Formula is used to calculate the market price per share and book value per share.
P/B Ratio Formula = Market Price Per Share / Book Value Per Share
Where:
- Market Price Per Share = Current Market Price of the Share
- Book Value Per Share = (Total Assets- Intangible Assets- Total Liabilities)/ Number of Outstanding Shares
Steps to Calculate P/B Ratio:
- Step 1: Find the current market price of the share.
- Step 2: Calculate Book Value Per Share by using the above Formula.
- Step 3: Divide Step 1 by Step 2.
For Example:
Suppose there is a company XYZ Ltd., which manufactures solar panels and batteries for renewable energy projects. It is listed on the Indian Stock Market and presented its Financial Statements for the Fiscal year ending 31st March 2024. The Market Price of XYZ Ltd. shares is ₹250.
Here are the key extracts from the financial statements of XYZ Ltd.
- Current Assets = ₹50,00,000
- Non-current Assts=₹40,00,000
- Total Liabilities =₹35,00,000
- Total Outstanding Shares =₹20,000
For understanding the P/B Ratio Formula, follow these steps:
Step 1: Calculate Book Value
Book Value = Total Assets-Total Liabilities
Book Value = ₹90,00,000-₹35,00,000
= ₹55,00,000
Step 2: Market Price is given₹250
Step 3: Book Value Per Share:
= ₹55,00,000/₹20,000=₹275
Step 4: Calculate the P/B Ratio using the formula Market Price Per Share/ Book Value Per Share:
₹250/₹275 = 0.91
The meaning of the good P/B Ratio Formula, with the help of the above example is shows that the market price is slightly below the book value, so the company is undervalued.
From the above calculations, it can be said that the investors are paying less than the company’s asset value, but investors may see a potential buying opportunity in the future.
What do a High P/B Ratio and a Low P/E/ Ratio mean?
- High P/B Ratio Meaning: The high P/B Ratio indicates that the stock is overvalued, and it is usually higher than 1. This value indicates to the investors that a particular stock is trading at a higher value than its book value or intrinsic value.
- Low P/B Ratio Meaning: The low P/B Ratio indicates undervaluation of stock, and it is usually lower than 1. A low P/B Ratio indicates that the stock is trading at a lower value than its actual worth, and the underlying company of the stock is facing difficulty, which has reduced the P/B Ratio value.
Interpretation of Good P/B Ratio
As we discussed above, the P/B Ratio meaning and the P/B Ratio Formula, we now discuss some other important information about the good P/B Ratio that actually helps investors to invest confidently. The good P/B Ratio creates a relationship between what the market perceives as the value of the company’s equity to the book value of its equity. The important factor that investors should consider before analysing the good P/B Ratio of any company is that the market capitalisation is future-looking, and it reflects the current perception of the company’s equity value. A good P/B ratio under 1.0 typically indicates a solid investment by value investors.
P/E Vs P/B Ratio in the Stock Market:
The following are the key differences between P/E vs P/B Ratio:
| Basis of Difference | P/E Ratio(Price to Earnings Ratio) | P/B Ratio(Price to Book Ratio) |
| Meaning | P/E Ratio shows the current price of the company’s share to itsEarning per Share. | P/B Ratio shows the current market value to its book value. |
| Formula | Price per Share÷ Earnings per Share | Price per Share÷ Book Value per Share |
| What is the Estimate | How much investors are willing to pay for each rupee of the company’s earnings. | How much investors are willing to pay for each rupee of the company’s net assets. |
| Focus | Profitability of the company | Asset Valuation of the company. |
| Best For | Steady and predictable earnings of the company | Capital-intensive companies (like banks, real estate) |
| Inference | It states the number of years it takes for the company to pay the price paid for each share. | It states the pricing of the company’s equity by the market price. |
Which is More Relevant: P/E Vs P/B Ratio
Both P/E and P/B Ratios are relevant for investors who want to invest in a profit-making company. However, selecting a good P/E Ratio (Price-to-Earnings Ratio) and a suitable P/B Ratio (Price-to-Book Ratio) plays a crucial role in analysing the stock market. Therefore, here is the key explanation of P/E vs P/B Ratio Relevance in each different sector.
Relevance of P/B Ratio( Price to Book Ratio)
The P/B Ratio is mostly used valuation Ratio for valuing banking and financial services companies. In this sector P/B Ratio is more preferred than the Price to Earnings Ratio.
- For the Allocation of Funds good P/B Ratio helps to assess the company by considering the market capitalisation to its book value.
- Credit Spread is a good indicator when comparing the performance with a bank. The P/B Ratio is determined based on the capacity to control NPA.
- For analysing the performance of the banks good P/B Ratio is more favourable and also helps in giving an accurate Valuation.
- A good P/B Ratio represents the optimal utilisation of funds, which plays an important role in valuing it.
- The P/B Ratio Formula also helps in determining the true value by depicting the picture of how much credit utilisation is in funds.
Relevance of P/E Ratio( Price to Earnings Ratio):
The Price to Earnings Ratio is mostly used in valuation ratios in finance. It is also relevant because it connects the market price of the company with its earnings power.
- The Price to Earnings Ratio works as a valuation tool and shows whether a stock is undervalued or overvalued when it comes to comparing P/E vs P/B Ratio.
- The Price to Earnings Ratio helps in comparing companies which involved in the same industry or sector.
- A good P/E Ratio indicates a signal of higher growth expectations, while a lower P/E ratio may indicate risk or slow growth.
- When investors are stuck in a dilemma of choosing between P/E vs P/B Ratio, a good Price to Earnings Ratio helps investors in making Investment decisions.
After considering all the above key points by comparing P/E vs P/B Ratio, it shows that a profit-making company is always considered a good price to earnings ratio; meanwhile, P/B Ratio is widely used by banks and other financial institutions. A good P/B Ratio is not useful for loss-making companies. An asset wealth company always makes a move to choose the right valuation ratio between the P/E ratio and vs P/B ratio.
Both the P/E vs P/B Ratio provide relevance in their own way to all the companies and investors. There is a need to choose the most authentic ratio for their future growth perception.
Objectives of the P/E Vs P/B Ratio
When investors are trying to analyse the best stocks, the P/E Vs P/B Ratio( Price to Earnings Ratio Vs Price to Book Ratio) helps them in fundamental analysis. P/E Vs P/B Ratio is used widely in terms of comparison and to assess the company value through its earnings power or its asset base.
As we discussed earlier, the Price to Earnings Ratio, meaning, and the Price to Earnings Ratio formula, the P/E Ratio shows how much investors are willing to pay for each unit of a company. When the P/E Ratio is slightly better than the average of the industry, then it is considered a good P/E Ratio.
P/B( Price to Book Ratio) shows how much investors are paying for a company compared to its net assets, and also helps in evaluating the stability and asset base of the company. A good P/B Ratio is widely useful for asset-heavy industries and the real estate industry. The main objective of the P/B Ratio is to evaluate whether a company’s stock is justified by its net asset value or not; it is also considered a main tool for asset-backed valuation and financial stability.
The P/E vs P/B Ratio is to provide growth expectations and shows financial stability in their industry and sector. Every investor must know the real meaning of the P/E Ratio vs P/B Ratio for their profitability and asset value. The focus on earnings power and growth potential is the main objective of a good Price to Earnings Ratio.
The objective of a good Price to Book Ratio is mainly to focus on asset value and stability
What is the ideal P/B Ratio?
An ideal or good P/B Ratio usually lies between 1 and 3. This means if the value becomes below 1, then the stock is undervalued, and if the value becomes above 3, then investors can expect high growth and strong profitability, but it also means overvaluation.
What is the ideal P/E Ratio?
The ideal or good P/E Ratio depends on the conditions of the industry. It varies from industry to industry. The value between 10-20 is considered healthy for banks and financials, and the range between 20-40 can be justified for fast-growing sectors like IT, FMCG, and Tech.
Hence, both P/E Vs P/B ratio give an ideal range for analyzing the conditions of the stock market and also help investors to invest ideally in the profit-making company.
How to use the P/B Ratio and the P/E Ratio?
The good P/B Ratio and the good P/E Ratio are used in different ways, and by applying different methods to find the real meaning and usage of a good P/B Ratio and a good P/E Ratio. P/E Vs P/B Ratio is used to calculate the assets and profitability level of the stock. We will understand the P/E Ratio Vs P/B Ratio usage by understanding the P/E Ratio Formula and P/B Ratio Formula.
Steps to using a good P/B Ratio
- Understand the P/B Ratio Formula = Market Price per Share÷ Book Value per Share
- Compare with Fair Value: P/B= 1: Fairly Priced Stock, P/B<1: Stock may be undervalued, P/B>1: Investors can expect future growth and high profitability.
- Compare with the industry peers: Investors should compare the P/B Multiple across all the sectors and the same industry peers.
Steps to using a good P/E Ratio
- Understand the good P/E Ratio formula:= Price Per Share/Earnings per Share
- Compare with Industry Average : A good P/E Ratio is not universal- it depends on the banking, FMCG, and Manufacturing sectors. The value for Banks is 10-20, the value for FMCG is 20-40, and for manufacturing is 8-15.
P/E Ratio Vs P/B Ratio Vs ROE
In banks, a good P/B Ratio is the first measure of valuation. We should also consider ROE to assess the financial health of a bank. P/B Ratio Vs ROE plays an important role similar to the P/E Vs P/B Ratio.
| Basis | P/E Ratio(Price to Earnings) | P/B Ratio(Price to Book) | ROE(Return on Equity) |
| Meaning | Measures how much investors are willing to pay for each unit of earnings | Measures how much investors are paying in comparison to the company’s net asset value | Measures how much the company generates profit from shareholder equity. |
| Formula | Market Price per Share÷ Earnings per Share | Market Price per Share÷ Book Value per Share | Net Income÷ Shareholders’ Equity |
| Ojective | To analyse whether the stock price is reasonable given earnings | To check whether the stock price is justified by its net assets. | To evaluate the ability of the company to generate returns for shareholders. |
| Main Focus | Growth and Profitability Expectations | Assets and financial stability | Efficiency of using equity capital. |
| Limitations | It can be manipulated by accounting for earnings. | Not useful for asset-light firms | Inflation can be increased by high leverage. |
| High Value | Possibility of high growth or overvaluation | Market values assets highly, strong profitability | Strong profitability and efficient use of equity. |
The above P/E Vs P/B Ratio Vs ROE shows that you can get a more effective analysis if investors use Price to Earnings Ratio and Price to Book Ratio in conjunction with ROE or Return on Equity Ratio. It provides better insights into the growth prospects of the bank. Good P/B Vs P/E Ratio increases the tendency of loss loss-making company to become a healthy company.
Limitations of P/B Ratio Vs P/E Ratio:
After understanding the good P/E Vs P/B Ratio meaning, the Price to Earnings Ratio Formula with Price to Book Ratio, we observe that both good P/E Ratio Vs P/B Ratio are important and also help investors to make their decisions widely by using the right Price to Earnings Formula and applying the True Price to Book Ratio meaning. After all, there are some
limitations of the good P/E Vs P/B Ratio which should also be considered and known by all investors.
- The Price to Earnings Ratio is calculated by using the formula of Market Price per Share/ Earnings Per Share, so accounting adjustments can manipulate EPS; meanwhile, the good P/B Ratio ignores profitability.
- The good P/E Ratio does not consider assets, liabilities, or debt level. The P/B Ratio is not suitable for tech services or asset-light companies. The P/E Vs P/B Ratio could not give a true picture of the high-priced stocks.
- The Good P/E( Price to Earnings Ratio) is generally not comparable across industries. For the P/B Ratio, the assets on the balance sheet are recorded mostly at historical costs.
- When the EPS is found to be negative, the Price to Earnings Ratio cannot be used, and the P/B Ratio is limited because it depends too much on assets.
- The P/E Ratio Formula only gives the investors information about the profitability, and is also used only by high asset companies.
Let’s Wrap
All the above descriptions on P/E Vs P/B Ratio show that they both are essential tools for evaluating a company’s valuation and financial health. As we see, a good Price to Earnings Ratio focuses on earnings performance. A high P/E Ratio signals overvaluation, while a low P/E Ratio shows undervaluation. In short, we have discussed the PE and PB ratios in detail in this article. We have discussed about P/E Ratio Vs the P/B Ratio, the Meaning and the P/B Ratio Formula, and the P/E Ratio Formula above to help investors in making rational decisions.
Disclaimer: Investing only by looking at the P/E Vs P/B Ratio can prove harmful because there are many other factors at work in the stock price.
FAQs on P/E & P/B Ratios:
- What are P/E and P/B ratios?
Ans. Price to Earnings Ratio shows the comparison between Price per Share and Earnings Per Share. P/B Ratio shows the comparison of the current market share to its book value per share. P/E Vs P/B Ratios are both used in different ways for investors and for analyzing the market.
- What is a Good P/B Ratio for Banks?
Ans. A good P/B Ratio can be said when the stock is fairly valued, which means when( stock price is equal to the book Value. Both P/E Vs P/B ratios are equally relevant for Banks and high assets companies, which helps investors in making decisions.
- Is a low P/E ratio good?
Ans. A low P/E Ratio can be a good sign, suggesting a stock might be undervalued compared to its Earnings, and the stock is cheap compared to its earnings. P/E Vs P/B Ratio, which is low, can be optimized by the investors in the very long-term.
- What is the best P/B Ratio?
Ans. The best or good P/B Ratio prefers values lower than 1.0, which suggests that an undervalued stock may have been found. Investors may frequently be equities with a less strict P/B value of less than 3.0. P/E Vs P/B Ratio, both are best in their optimal value of considering the stocks.
- What does the P/E Vs the P/B Ratio show?
Ans. The P/E Vs P/B Ratio both show about the Valuations, although a good P/B Ratio shows how much investors are willing to pay for each unit of the company’s net assets. A good P/E Ratio shows the company’s earnings. By using the P/E Ratio Formula and the P/B Ratio Formula, investors can evaluate the condition of Stocks.
Also Explore
Read Our Articles on the Best Stocks
Best Cement Stocks To Invest in India
What is Earnings Per Share EPS?
Top Multibagger Penny Stocks For 2025 | Potential Picks
Fundamentally Strong Stocks on NSE in 2025
Debt-Free Penny Stocks in India 2025
Best Realty Stocks In India 2025
Debt Free Penny Stocks Below 1 Rupee
Best Hotel Stocks in India to Invest In
Best Bike Stocks in India For 2025
Also Explore
Recent Articles

Sundaram Long Term Tax Advantage Fund Series IV vs Bank of India Mid Cap Tax Fund Series 1 Regular Growth: NAV, Returns and Maturity Status Compared
21 July 2026

Sundaram Long Term Tax Advantage Fund Series III vs UTI Series IV: NAV, Returns and Maturity Status Compared
21 July 2026

Sundaram Long Term Tax Advantage Fund Series II vs SBI Series IV: NAV, Returns and Maturity Status Compared
21 July 2026

Sundaram Long Term Tax Advantage Fund Series III vs UTI Series VI: NAV, Returns and Maturity Status Compared
21 July 2026
Note: This blog is for information purpose only. Investments and trading are subject to market risks, read all scheme related documents carefully.
Reviews


Recent Posts
Sundaram Long Term Tax Advantage Fund Series IV vs Bank of India Mid Cap Tax Fund Series 1 Regular Growth: NAV, Returns and Maturity Status Compared
Sundaram Long Term Tax Advantage Fund Series III vs UTI Series IV: NAV, Returns and Maturity Status Compared
Sundaram Long Term Tax Advantage Fund Series II vs SBI Series IV: NAV, Returns and Maturity Status Compared
Sundaram Long Term Tax Advantage Fund Series III vs UTI Series VI: NAV, Returns and Maturity Status Compared
UTI Long Term Advantage Fund Series III vs Sundaram Micro Cap Series III Regular: NAV, Returns and Maturity Status Compared
Popular this week
Sundaram Long Term Tax Advantage Fund Series IV vs Bank of India Mid Cap Tax Fund Series 1 Regular Growth: NAV, Returns and Maturity Status Compared
Sundaram Long Term Tax Advantage Fund Series III vs UTI Series IV: NAV, Returns and Maturity Status Compared
Sundaram Long Term Tax Advantage Fund Series II vs SBI Series IV: NAV, Returns and Maturity Status Compared
Sundaram Long Term Tax Advantage Fund Series III vs UTI Series VI: NAV, Returns and Maturity Status Compared
UTI Long Term Advantage Fund Series III vs Sundaram Micro Cap Series III Regular: NAV, Returns and Maturity Status Compared

Uniresearch Global Pvt Ltd
Research Analyst
SEBI Registration Number — INH000013776
Uniresearch is a subsidiary of Univest Communication Technologies Private Limited
Company Address: Registered Address: Ground Floor, Unitech Commercial Tower 2, Block B, Greenwood City, Unit 1-3, Sector 45, Gurugram, Haryana 122003
Write to us : support@univest.in, compliance@univest.in
Verify on SEBI registry →RESEARCH ANALYST
Get SEBI Registered
advice on the stocks
trending today.
Get 3 FREE Trade Ideas
for Startups Accelerator 2024
Trusted by 1Cr Indians
Awarded No.1 by Economic Times