
EBITDA (Earnings Before Interest, Taxes, Depreciation & Amortisation)
Updated: 3 Nov 2025 • 4:35 pm
Posted by:

Click Here – Get Free Investment Predictions
EBITDA stands for Earnings Before Interest, Taxes, Depreciation and Amortisation and is a metric used to evaluate a company’s operating performance. EBITDA is widely used to assess a company’s performance and helps determine its underlying profitability and operating performance, i.e., how much profit the business generates from providing services, selling goods, and other activities within a given time period. This type of analysis helps provide a view of the profitability of operating a business against your long-term benchmark. Earnings before interest, taxes, depreciation, and amortisation aim to show the cash profit generated by the company’s operations.
What is EBITDA?
EBITDA or Earnings Before Interest, Taxes, Depreciation, and Amortisation, is a financial metric. Companies use it mainly to compute their economic performance. EBITDA meaning as earnings before interest, taxes, depreciation, and amortisation, providing a clear view of core earnings. The EBITDA metric is a variation of operating income (EBIT) that excludes certain non-cash expenses, as it is not recognised under IFRS or US GAAP. In fact, confident investors like Warren Buffett have a particular opinion on this metric, as it does not account for the depreciation of a company’s assets.
Key Highlights for EBITDA:
- EBITDA is short for Earnings Before Interest, Taxes and Depreciation. It is another term we use for cash flow after the add-back of Depreciation and Amortisation. It is also independent of a company’s capital structure.
- EBITDA can be calculated in multiple ways and is extensively used in valuation.
- However, EBITDA is a non-IFRS/non-GAAP calculation, and there are many critics of EBITDA, including Warren Buffett.
How Does EBITDA Use: Know About Users
EBITDA is widely used by businesses, valuators, bankers, and others to compare a company’s financial performance to that of its industry peers and gauge its profitability before considering non-core expenses and charges.
- Businesses and Valuators: Entrepreneurs and business valuators often use EBITDA to calculate a company’s valuation for purposes of a business sale or acquisition. A standard valuation method is to apply a multiple to EBITDA to determine the business’s value.
- Financial Institutions: Bankers use EBITDA to understand how much cash flow a company has available to pay for long-term debt. Bankers also use it to calculate a company’s debt coverage ratio, which is another measure of its ability to make debt payments.
- Investors: Investors have used EBITDA to compare profitability across companies and industries, and it helps them understand a firm’s core earnings potential before accounting for non-cash expenses.
- Lenders and Creditors: Banks and other financial institutions use EBITDA to assess a company’s ability to repay debt, as it reflects the cash flow available to service interest and principal payments.
How is EBITDA Calculated?
The calculation of EBITDA involves subtracting a company’s expenses other than interest, taxes, depreciation, and amortisation from its net income.
Steps to Calculate EBITDA:
Here are the steps to determine EBITDA:
- Acquire the business income statement: An income statement is a document that lists a business’s revenue and costs over a period of time, such as a fiscal quarter or a year. At a minimum, the income statement has the categories “revenues” and “expenses”.
- Identify figures: The numbers that are needed to calculate EBITDA are available on the income statement. The document uses the EBITDA formula with net income, and these are considered in the non-operating subcategory of the expenses category.
- Calculate EBITDA: The first option is to take the net income, interest expense, taxes, depreciation, and amortisation figures from the income statement and add them together, and the second option is to add the operating income, depreciation and amortisation figures from the income statement to find EBITDA.
EBITDA Formula:
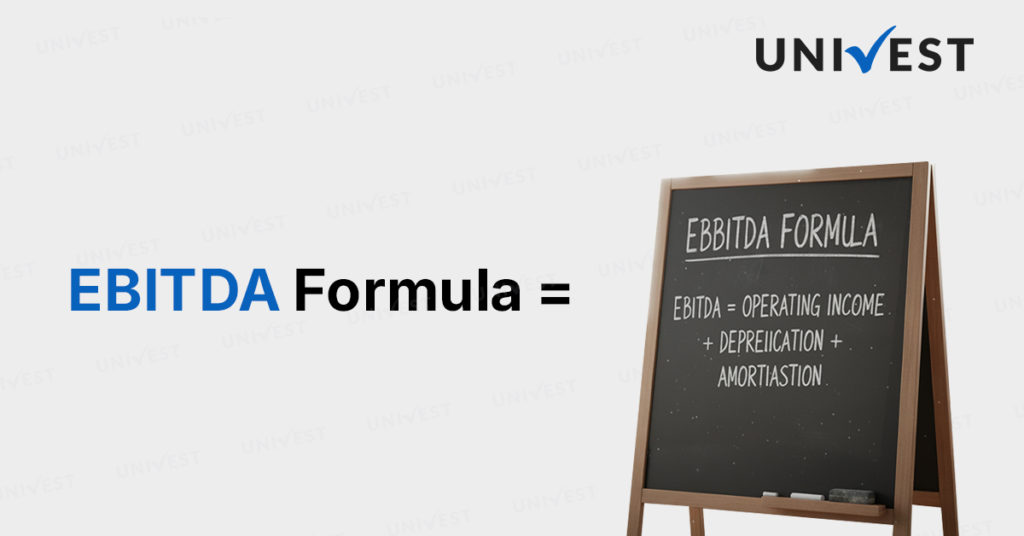
The top-down EBITDA starts with operating profit (EBIT) from the income statement and adds back depreciation and amortisation (D&A) from the cash flow statement (CFS).
EBITDA Formula = Net Profit + Interest + Taxes + Depreciation + Amortisation
OR
EBITDA Formula = Operating Income + Depreciation + Amortisation
OR
EBITDA Formula = EBIT + Depreciation + Amortisation
On the income statement, the non-cash D&A expense is spread as a separate line item, apart from COGS and Operating expenses (SG&A).
Therefore, one practical tip is to use the D&A expense from the cash flow statement (CFS) to ensure accuracy.
Here are the descriptions for the terms that we used in the formula:
- Net Income: This is the company’s total revenue minus all expenses, including costs of goods sold (COGS), operating expenses, interest, taxes, and other relevant costs. Net income is the “bottom line” profit that remains after all fees are deducted from revenue.
- Interest: Interest represents the cost of borrowing for a company. It includes interest on loans, bonds, and other forms of debt. By adding back interest to net income, EBITDA provides a clearer picture of the company’s operating performance, free of the impact of financing decisions.
- Taxes: Taxes include both income taxes and other taxes paid by the company. By adding back taxes to the calculation, EBITDA eliminates the impact of the company’s tax environment, resulting in more stable profits.
- Depreciation: It is a non-cash expense that reflects the reduction in the value of tangible assets over time. Including depreciation in the EBITDA calculation helps remove the impact of this accounting measure.
- Amortisation: Amortisation is similar to depreciation but applies to intangible assets, such as patents, trademarks, and goodwill. Adding back amortisation to the EBITDA calculation has adjusted the non-cash expenses.
Example of EBITDA Calculation
Below, we will discuss the Income Statement of Asian Paints as of 30th March, 2025, for the calculation of EBITDA.
| Particulars | Amount (₹) |
| Total Revenue | 19,16,36,800 |
| Cost of Revenue | 11,49,88,200 |
| Operating Expense | 4,55,86,000 |
| Selling, general and administrative expenses | 1,07,99,400 |
| Interest expense | 5,10,000 |
| Income Tax | 1,09,88,200 |
| Income from operations | 2,21,19,100 |
| Net Income | 2,15,94,900 |
As per the Cash Flow Statement, the company’s depreciation and amortisation stood at ₹43,06,700.
Earnings before Interest, Taxes, Depreciation and amortisation do not consider income tax and interest. So the EBITDA of Asian Paints for the Financial Year 2018-19 would be,
EBITDA Formula = Net Income + Interest + Taxes + Depreciation + Amortisation
EBITDA = ₹( 21594900 + 5,100,00 + 10988200 + 4306700)
EBITDA = ₹37,399,800.
You must note that the slightest mistake in the values of these components would impact a firm’s profitability significantly. To avoid this, special care must be taken to keep finances up to date and use a reliable accounting system.
Sign up on Univest to get more investment predictions and access to exclusive screeners! Click here.
EBIT Vs EBITDA
| Basis | EBIT (Earnings Before Interests & Taxes) | EBITDA (Earnings Before Interests, Taxes, Depreciation & Amortisation) |
| Interest & Taxes | Eliminates Interest & Taxes | Eliminates interest, taxes, depreciation and amortisation |
| Non-cash outlays | It includes non-cash outlays like depreciation and amortisation | It does not include non-cash outlays. |
| Operating Earnings | It is widely reported, typically by highly leveraged organisations with good operating earnings. | It is usually preferred as a profitability measure for organisations that have sustainable investments in fixed assets. |
| Reliability | Investors do not properly rely on EBIT calculations, as they can give a misleading impression. | It will provide you with reliable information and not mislead you. |
What is EBITDA Margin?

Tap to Access Best Research Pieces
EBITDA margin refers to the relation between a firm’s aggregate earnings and total revenue. It mainly indicates how much profit a firm can generate in a year. EBITDA margin is a profitability ratio that measures the percentage of revenue a company generates before interest, taxes, depreciation, and amortisation. Earnings are calculated by taking sales revenue and deducting operating expenses, such as cost of goods sold (COGS) and selling, general, & administrative (SG&A) expenses, but excluding depreciation and amortisation.
What is the Formula for EBITDA Margin?
The first step in calculating EBITDA is to obtain earnings before interest and taxes (EBIT) from the income statement. The next step is to add back the depreciation and amortisation expenses.
EBITDA Margin = Operating Income (EBIT) + Depreciation + Amortisation
To compute the EBITDA ratio, the following formula is used:
EBITDA Margin = Operating Income (EBIT) + Depreciation + Amortisation
To compute the EBITDA ratio, the following is used:
EBITDA Margin = EBITDA/ Net Sales
EBITDA Used in Valuation (EV/EBITDA Multiple)
While comparing two companies, the Enterprise Value/EBITDA ratio can give investors a general idea of whether a company is overvalued (high ratio) or undervalued (low ratio). It’s essential to compare companies that are similar in nature (same industry, operations, customers, margins, growth rate, etc.), as different sectors have vastly different average ratios (high ratios for high-growth industries, low ratios for low-growth sectors).
Download the Univest iOS App or the Univest Android App to get daily stock recommendations and insightful research pieces!
EV/EBITDA Example:
Company ABC and Company XYZ are competing grocery stores that operate in New York. ABC has an enterprise value of $200M and an EBITDA of $10M, while firm XYZ has an enterprise value of $300M and an EBITDA of $30M. Which company is undervalued on an EV/EBITDA basis?
Sol. Company ABC:
EV = $200M
EBITDA = $10M
EV/EBITDA = $200M/$10M
= 20x
Company XYZ:
EV = $300M
EBITDA = $30M
EV/EBITDA = $300M/ $30M
= 10x
EBITDA as a Financial Metric
EBITDA shows a company’s financial performance without taking into account its capital investments, including plant, property, and equipment. It also does not account for debt-related expenses and emphasises the firm’s operating decisions.
All these reasons highlight why it may not be an accurate measure of profitability. Additionally, it is often used to hide poor financial judgment, such as taking on a high-interest loan or using fast-depreciating equipment with high replacement costs.
EBITDA Coverage Ratio
The EBITDA-to-interest coverage ratio, or EBITDA coverage ratio, is a financial metric that is used to assess a firm’s financial capability. It examines whether pre-tax income would be sufficient to cover the firm’s interest-bearing expenses.
EBITDA Coverage Ratio: Formula
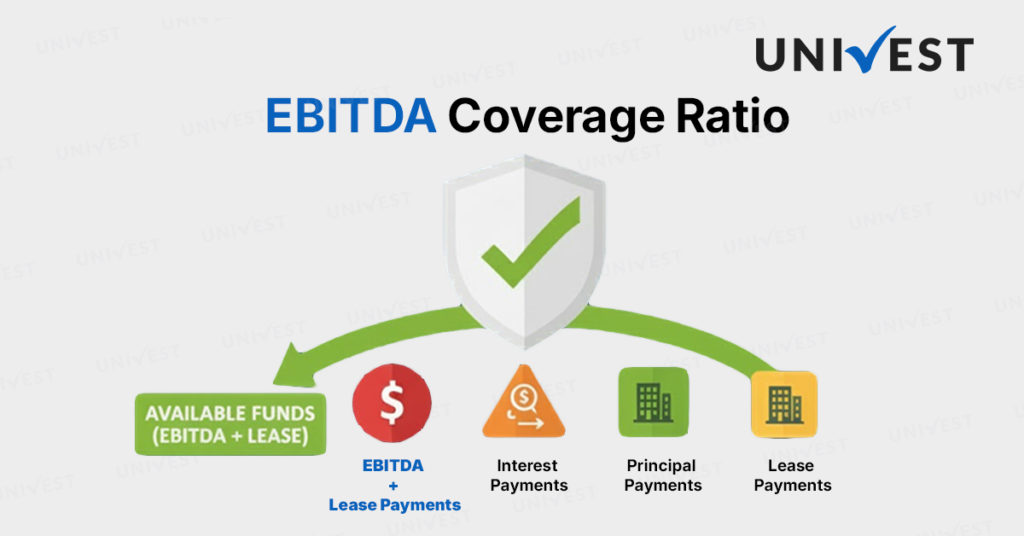
EBITDA Coverage Ratio = (EBITDA + Lease Payments)/ (Interest Payments + Principal Payments + Lease Payments)
Explanation:
If the outcome is greater than 1 or equal to 1, it suggests the firm is financially strong. Furthermore, it indicates that the firm can repay its liabilities. It must be noted that there is a fundamental difference between the EBITDA-to-interest coverage ratio and EBITDA coverage. For instance, the interest coverage ratio uses earnings before interest, taxes, and depreciation, whereas the latter uses a broader measure, EBITDA.
EBITDA in Financial Modelling
EBITDA is used frequently in financial modelling as a starting point for calculating unlevered free cash flow. Earnings before interest, taxes, depreciation, and amortisation is such an often-referenced metric in finance that it is helpful to use it as a reference point, even though a discounted cash flow (DCF) model values the business based on its free cash flow.
Example: Company XYZ accounts for its $12,000 depreciation and amortisation expense as part of its operating expenses. Calculate their Earnings Before Interest, Taxes, Depreciation and Amortisation.
Sol. EBITDA = Net Income + Tax Expense + Interest Expense + Depreciation & Amortisation Expense
= $19,000 + $19,000 + $2,000 + $12,000
= $ 52,000
EBITDA = Revenue – Cost of Goods Sold – Operating Expenses + Depreciation & Amortisation Expense
= $82,000 – $23,000 – $19,000 + $12,000
= $52,000.
EBITDA Vs Net Income
| Basis | EBITDA | Net Income |
| Defination | It stands for earnings before interest, taxes, depreciation, and amortisation, making it an estimate of a company’s operating revenues. | Net Income is a more conservative calculation that considers all expenses, including taxes and interest. |
| Operating Expenses | EBITDA provides a clearer picture of a company’s operating performance by factoring out non-operating expenses. | Net income is determined by subtracting a company’s total operating expenses from its revenues. |
| Depreciation & Amortisation | The main benefit of using EBITDA is that it’s relatively easy to calculate since it ignores non-cash expenses like depreciation and amortisation. | It’s important to note that net income considers depreciation and amortisation, while EBITDA doesn’t. |
| Indicates | EBITDA measures a company’s earnings before deductions for taxes, costs, depreciation, and amortisation. | EBITDA is a good indicator of operating performance, and net income is a more comprehensive metric that reflects profitability. |
Advantages of EBITDA
- It offers a reliable structure for the business growth and the effectiveness of its operational model.
- The risks associated with variables that mainly affect financial variables, including capital investment, are significantly reduced.
- It shows the actual value of a company’s cash flow generated by active operations.
- EBITDA only accounts for expenses required to keep a firm’s day-to-day operations running.
- A company’s debt does not get transferred during a sale, and therefore, how a firm has been financed is usually not taken into account.
Disadvantages of EBITDA
Some disadvantages of the EBITDA are given as follows:
- Due to the fact that debt expenses are excluded from EBITDA, the resulting figure is considered to be misleading. It does not disclose the information value of a company’s actual earnings or liquid assets.
- Many business owners use it to approve their poor financial judgment and finance-related shortcomings.
- Companies are required to use other financial metrics along with EBITDA to arrive at a more accurate financial metric.
- It does not affect high-interest financial debt, and companies are required to use other financial metrics alongside EBITDA. It is an efficient way to measure a firm’s core profit trends.
Conclusion
EBITDA provides a brief overview of a company’s operational efficiency and profitability, excluding the impact of financing and accounting decisions. It is important to interpret EBITDA in the context of the industry, as different sectors may have varying levels of capital intensity and depreciation. Additionally, investors should be aware of any specific adjustments the company makes to EBITDA calculations in the context of the industry, as some companies may exclude certain expenses to present a more favourable picture of their financial performance. EBITDA meaning as earnings before interest, taxes, depreciation, and amortisation, providing a clear view of core earnings. The EBITDA metric is a variation of operating income (EBIT) that excludes certain non-cash expenses, as it is not recognised under IFRS or US GAAP.
FAQs
What is EBITDA?
Ans. EBITDA or Earnings Before Interest, Taxes, Depreciation, and Amortisation, is a financial metric. Companies use it mainly to compute their economic performance. EBITDA meaning as earnings before interest, taxes, depreciation, and amortisation, providing a clear view of core earnings. Earnings before interest, taxes, depreciation, and amortisation aim to show the cash profit generated by the company’s operations.
What is amortisation in EBITDA?
Ans. In EBITDA, Amortisation refers to expensing intangible assets, as we know intangible assets are non-physical assets; examples include goodwill, copyrights, patents, trade names, customer lists, contracts, and franchise agreements. Intangible assets are typically complex compared to fixed assets.
How to calculate EBITDA?
Ans. EBITDA can be calculated by utilising the information from a business’s income statement, cash flow statement, and balance sheet. The formula is as follows.
EBITDA = Net Income + Interest + Taxes + Depreciation + Amortisation. On the income statement, the non-cash D&A expense is spread as a separate line item, apart from COGS and Operating expenses (SG&A).
What are the advantages of the EBITDA?
Ans. EBITDA offers a reliable structure for business growth and the effectiveness of its operational model. The risks associated with variables that mainly affect financial variables, including capital investment, are significantly reduced. EBITDA only accounts for expenses required to keep a firm’s day-to-day operations running.
What can be considered a reasonable EBITDA?
Ans. As mentioned, EBITDA is a metric that tells about the company’s financial performance and profitability, so a higher EBITDA is clearly better than a lower EBITDA.
Also Explore
| Best Stocks | Multibagger Stocks | Penny Stocks | Fundamentally Strong Stocks | Sector-Wise Stocks | PSU /Government Stocks |
| For the Next 10 Years | For the Next 5 Years | Solar Penny Stocks | On BSE | Solar Energy Sector | PSU Stocks List |
| Long Term | Below 100 Rs | Top 5 Penny Stocks | For Long-Term | Hospitality Sector | PSU Stocks in 2025 |
| Best Bike Stocks | For 2025 | Best Penny Stocks in India | Penny Shares | Hotel Sector | Government Stocks in 2024 |
| Best Liquor Stocks | High-Growth Stocks | For 2025 | Agriculture Sector | Government Stocks List | |
| Best Railway Stocks | Under 500 | Penny Stocks | Pharma Sector | Government Stocks in 2025 | |
| Best Auto Stocks | For 2026 | Oil and Gas Sector |
Univest Screeners
Recent Articles
Note: This blog is for information purpose only. Investments and trading are subject to market risks, read all scheme related documents carefully.
Reviews


Recent Posts
3 PMAY Affordable Housing Beneficiary Stocks
3 Stocks With Sustained Operating Margin Expansion
3 Pig Iron and Ferrous Casting Input Stocks
3 Urban Discretionary Consumption Theme Stocks
3 Shipping and Marine Logistics Stocks
Popular this week
3 PMAY Affordable Housing Beneficiary Stocks
3 Stocks With Sustained Operating Margin Expansion
3 Pig Iron and Ferrous Casting Input Stocks
3 Urban Discretionary Consumption Theme Stocks
3 Shipping and Marine Logistics Stocks

Uniresearch Global Pvt Ltd
Research Analyst
SEBI Registration Number — INH000013776
Uniresearch is a subsidiary of Univest Communication Technologies Private Limited
Company Address: Registered Address: Ground Floor, Unitech Commercial Tower 2, Block B, Greenwood City, Unit 1-3, Sector 45, Gurugram, Haryana 122003
Write to us : support@univest.in, compliance@univest.in
Verify on SEBI registry →RESEARCH ANALYST
Get SEBI Registered
advice on the stocks
trending today.
Get 3 FREE Trade Ideas
for Startups Accelerator 2024
Trusted by 1Cr Indians
Awarded No.1 by Economic Times