State Bank Of India (SBIN) live share price today at NSE / BSE
06 July, 2026 18:38 | NSE : SBIN | BSE : 500112 | ISIN : INE062A01020
Expert Verdict for State Bank Of India (SBIN) Share
term
term

 80.10 (8.36%)since then
Stock is trading at a book value lower than the sector
FIIs have increased holding in the recent quarter
Company is debt-free with no outstanding liabilities
Stock has been generating a better returns than bank FD


Technical indicators for State Bank Of India (SBIN) Share

Company financials for State Bank Of India (SBIN) Share
| Quarter | Net Profit (Cr) |
|---|---|
| Mar' 26 | 196428.7 |
| Dec' 25 | 213171.1 |
| Sep' 25 | 211373.3 |
| Jun' 25 | 212014.7 |
| Mar' 25 | 196004.6 |
Financial indicators for State Bank Of India (SBIN) Share
| Period | ROE (%) |
|---|---|
| 2026 | 16.68% |
| 2025 | 18.66% |
| 2024 | 18.97% |
| 2023 | 18.44% |
| 2022 | 13.61% |
Peer Comparison for State Bank Of India (SBIN) Share
Shareholdings Pattern for State Bank Of India (SBIN) Share
| Opening Price: | 1,041.90 |
| Previous closing Price: | 1,040.00 |
| Volume of State Bank Of India (SBIN) share: | 87,61,017 |
| Value of Share: | 1,037.70 |
| Market Capitalisation: | 9,58,000 Cr. |
| P/E Ratio: | 11.50 |
| P/B Ratio: | 1.71 |
| Sector P/E: | 8.24 |
| EPS (TTM): | 90.24 |
| Dividend Yield: | 1.67 |
| 14D - RSI: | 55.78 |
| 50 DMA: | 1,009.87 |
| 200 DMA: | 1,007.90 |
Note: The above data is mentioned as per the State Bank Of India (SBIN) share price today.
State Bank Of India (SBIN) Share Price Today At NSE
- Live State Bank Of India (SBIN) Share Price NSE India: ₹1,037.70
- Previous Closing Price: ₹1,040.00
- Open Price: ₹1,041.90
- High: ₹1,048.40
- Low: ₹1,036.50
State Bank Of India (SBIN) Share Price Today At BSE
- Live State Bank Of India (SBIN) Share Price BSE India: ₹1,037.85
- Previous Closing Price: ₹1,039.90
- Open Price: ₹undefined
- High: ₹undefined
- Low: ₹undefined
Historical Price Of State Bank Of India (SBIN) Share
The table below shows the variations in State Bank Of India (SBIN) share price from January 2018 to July 2026.
| Month & Year | Price (INR) | Open Price (INR) | High Price (INR) | Low Price (INR) | Volume (Cr.) | Change % |
|---|---|---|---|---|---|---|
| January 2018 | ₹313.25 | ₹310.60 | ₹332.75 | ₹292.60 | ₹46,72,27,117 | 0.85 |
| February 2018 | ₹268.00 | ₹316.90 | ₹317.40 | ₹256.65 | ₹50,63,61,276 | -15.43 |
| March 2018 | ₹249.90 | ₹266.30 | ₹270.00 | ₹232.35 | ₹49,10,62,494 | -6.16 |
| April 2018 | ₹246.40 | ₹251.80 | ₹265.00 | ₹232.50 | ₹38,71,31,760 | -2.14 |
| May 2018 | ₹269.55 | ₹245.90 | ₹274.80 | ₹237.85 | ₹49,31,03,116 | 9.62 |
| June 2018 | ₹259.35 | ₹269.25 | ₹289.65 | ₹255.70 | ₹37,02,71,032 | -3.68 |
| July 2018 | ₹293.50 | ₹258.95 | ₹302.40 | ₹250.45 | ₹40,10,92,649 | 13.34 |
| August 2018 | ₹309.60 | ₹294.50 | ₹326.40 | ₹288.35 | ₹62,15,51,541 | 5.13 |
| September 2018 | ₹265.50 | ₹312.50 | ₹312.50 | ₹253.40 | ₹47,80,16,576 | -15.04 |
| October 2018 | ₹281.40 | ₹265.50 | ₹282.75 | ₹247.40 | ₹57,43,14,551 | 5.99 |
Shareholding Pattern of State Bank Of India (SBIN) Shares In Stock Market
The below depicted shareholding pattern is as per the State Bank Of India (SBIN) Industries Ltd. Share Price Market of March 2026.
| Promoters | 55.52% |
| Foreign Institutions | 11.41% |
| Retail and Others | 9.35% |
| Other Domestic Institutions | 10.43% |
| Mutual Funds | 13.29% |
| SBIN | State Bank Of India |
| BANKBARODA | Bank Of Baroda |
| UNIONBANK | Union Bank Of India |
| PNB | Punjab National Bank |
| IOB | Indian Overseas Bank |
| Face Value | 1.00 |
| ISIN | INE062A01020 |
| Market Lot | 1.00 |
| Instrument | EQUITY |
| (In Rs Cr) | Invalid date | Invalid date | YoY |
|---|---|---|---|
| Revenue | - | - | - |
| Op profit | - | - | - |
| Op profit% | % | % | - |
| NIM | % | % | - |
| Net profit | - | - | - |
| (In Rs Cr) | Invalid date | Invalid date | YoY |
|---|---|---|---|
| Revenue | - | - | - |
| Op profit | - | - | - |
| Op profit% | % | % | - |
| NIM | % | % | - |
| Net profit | - | - | - |
| (In Rs Cr) | Invalid date | Invalid date | YoY |
|---|---|---|---|
| Revenue | - | - | - |
| Op profit | - | - | - |
| Op profit% | % | % | - |
| NIM | % | % | - |
| Net profit | - | - | - |
Can a ₹15 lakh FD generate ₹1 lakh annual income? Here's the simple calculation
Livemint3 days ago
ICICI Bank plans $500 million dollar bond issue, first in a decade
Rediff3 days ago

A vote of confidence in our financial governance
Businessline3 days ago
Sensex, Nifty Rise on IT Surge, Softer US Jobs Data
Rediff4 days ago

Nifty holds above 24,350 at noon; IT, Pharma and Financials lead broad rally
Businessline4 days ago

Market today: Sensex sustains over 78,000 mark, Nifty above 24,300 as IT stocks extend rally HCL Tech jumps
Businessline4 days ago

ICICI Bank mulls first benchmark dollar bond sale since 2017
Businessline4 days ago
Stock markets today: Sensex, Nifty jump as IT stocks lead rally
Rediff4 days ago
SBI unveils a suite of AI-powered digital journeys for retail and business banking customers
Businessline5 days ago
SBI Boosts YONO Platform With New AI Features And Digital Journeys
Rediff5 days ago
Sensex Jumps 444 Points as Indian Markets Rebound After Two-Day Decline
Rediff6 days ago
SBI wanted Ram mandir cash-counting staff replaced months before alleged donation scam: Report
Livemint7 days ago
Jet Airways employees get PF, gratuity relief as NCLAT rejects SBI's plea against priority payout amid liquidation
Livemint7 days ago

Baldev Prakash takes charge as SBICAP Securities MD & CEO
Businessline7 days ago
Ram Mandir donation controversy: Bar Association warns ₹5 lakh fine on lawyers defending accused
Livemint7 days ago

The Latest Home Loan Interest Rates: Jun 26, 2026
Businessline10 days ago
The Latest Fixed Deposit Interest Rates: Jun 26, 2026
Businessline10 days ago
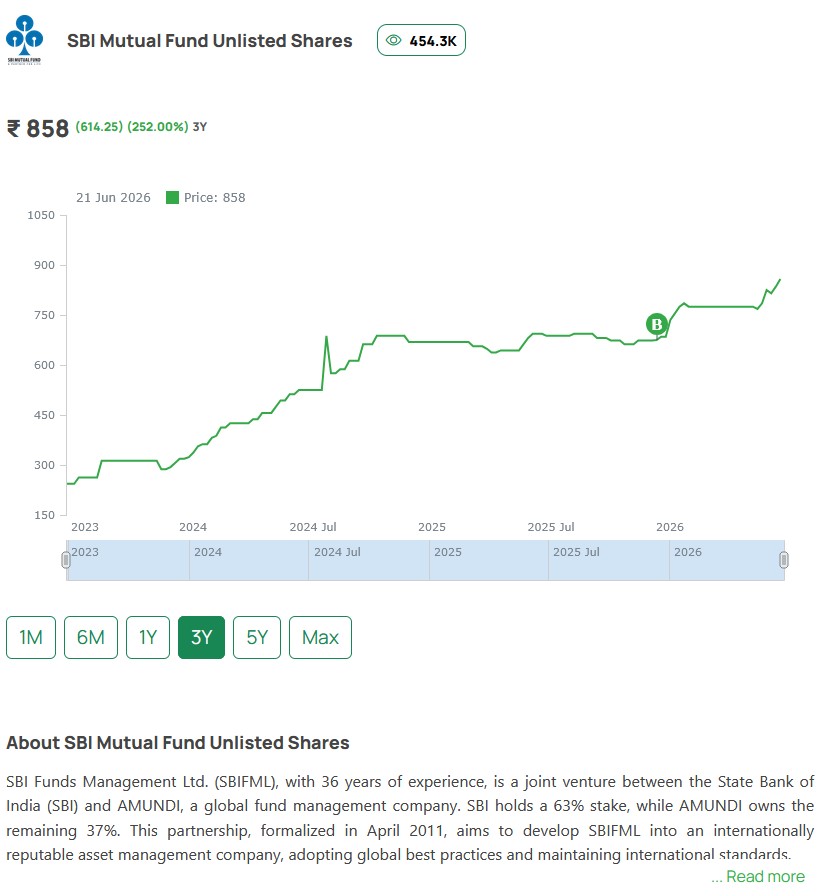
SBI Mutual Fund IPO: India’s Largest Asset Manager Set for ₹10,000 Crore Listing After Unlisted Shares Soar 3.8x in Three Years
10 days ago
Car loan interest rates June 2026: SBI, ICICI, HDFC and top banks offer rates from 7.35% – Full comparison
Livemint11 days ago

Stock Markets End in Green Buoyed by Falling Oil Prices and Positive Global Cues
Rediff12 days ago

Sbin FAQs
Is State Bank Of India a good stock to invest in?
Our expert verdict states that State Bank Of India is in Hold zone for Short term and is in Buy zone for Long term.
Should I buy State Bank Of India share now?
As per our verdict, State Bank Of India is in the Hold zone for Short term.
Should I buy State Bank Of India shares for the long term?
As per our verdict, State Bank Of India is in Buy zone for Long term.
What is State Bank Of India share price today?
The State Bank Of India share price today is 1037.7.
How to buy State Bank Of India share?
You can buy State Bank Of India shares on any demat broker by completing your KYC. Before buying any stock, check BUY/SELL/HOLD insights on the Univest App.
What is the share price of State Bank Of India?
The share price of State Bank Of India is 1037.7, please note that the price may vary on a real-time basis.
What is the PE and PB ratio of State Bank Of India?
PE ratio of State Bank Of India is 11.5 and PB ratio of State Bank Of India is 1.71.
How’s PE of State Bank Of India compared to its sector?
PE ratio of State Bank Of India is 11.5 whereas the sector PE ratio is 8.24.
What is the market cap of State Bank Of India?
State Bank Of India’s market cap is 957999.6.
What are today’s High and Low prices of State Bank Of India ?
Today’s High of State Bank Of India is 1048.4.
Today’s Low of State Bank Of India is 1036.5.