
Nifty Pharma Index Slips Nearly 2 Percent as Gland Pharma, Piramal Pharma Lead Sector Losers
- July 22, 2026
- Posted by: Ankit Jaiswal
- Category: News
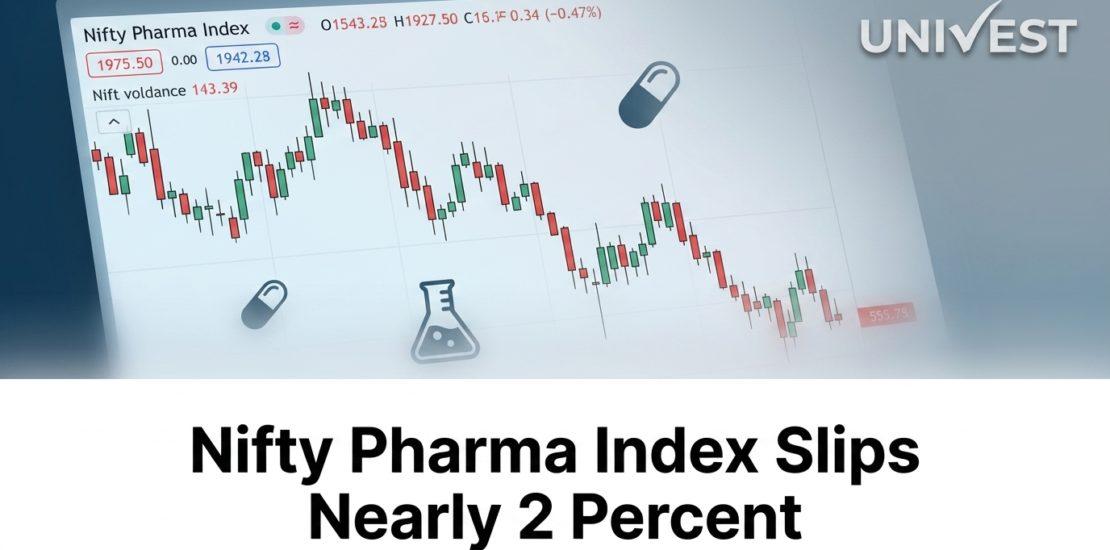
Nifty Pharma index at 25,636.20, down 1.75 percent. Gland Pharma worst hit, down 4.27 percent. 1 week down 1.41 percent, 1 year still up 14.92 percent.
The Nifty Pharma index came under broad based pressure on Wednesday, sliding close to 2 percent as nearly every major constituent traded in the red through the session. The index was last seen at 25,636.20, down 1.75 percent on the day, even as its one year return remains a healthy 14.92 percent, underlining how sharp the intraday reversal has been relative to the sector’s longer term trend.
Click Here – Get Free Investment Predictions
Nifty Pharma Top Stock Losers Today
| Company | CMP | Change (%) | Volume |
|---|---|---|---|
| Gland Pharma | Rs 2,376.30 | -4.27 | 90.50k |
| Piramal Pharma | Rs 178.24 | -3.56 | 2.65m |
| Aurobindo Pharm | Rs 1,530.90 | -3.09 | 408.93k |
| Alkem Lab | Rs 5,508.00 | -3.05 | 30.01k |
| Lupin | Rs 2,438.10 | -3.05 | 199.55k |
| Ajanta Pharma | Rs 3,470.00 | -2.95 | 30.16k |
| Glenmark | Rs 2,176.60 | -2.92 | 327.69k |
| Zydus Life | Rs 1,116.00 | -2.37 | 270.79k |
| Mankind Pharma | Rs 2,522.10 | -2.23 | 30.90k |
| Cipla | Rs 1,403.50 | -2.02 | 289.96k |
| Wockhardt | Rs 1,860.50 | -1.89 | 103.23k |
| Ipca Labs | Rs 1,766.00 | -1.83 | 23.72k |
| Biocon | Rs 432.80 | -1.70 | 1.32m |
| Abbott India | Rs 28,370.00 | -1.49 | 3.94k |
| Dr Reddys Labs | Rs 1,189.10 | -1.40 | 367.27k |
| Laurus Labs | Rs 1,572.00 | -1.33 | 245.76k |
| Divis Labs | Rs 7,234.00 | -1.31 | 34.14k |
| Sun Pharma | Rs 1,937.90 | -1.22 | 324.80k |
| Torrent Pharma | Rs 5,000.00 | -0.81 | 44.71k |
Learn More About Univest, a SEBI Registered Investment Advisor
Why the Nifty Pharma Index Is Down Today
Gland Pharma led the decline within the Nifty Pharma index, falling 4.27 percent, followed closely by Piramal Pharma, down 3.56 percent, and Aurobindo Pharma, down 3.09 percent. Large cap names such as Sun Pharma and Dr Reddys Labs also traded lower, though their declines were comparatively milder at 1.22 percent and 1.40 percent respectively, suggesting mid cap pharma names bore the brunt of today’s selling.
Sector wide selloffs in the Nifty Pharma index are frequently linked to profit booking after a strong run, since the index carries a healthy year to date gain of 12.82 percent and a one year return of 14.92 percent heading into today’s session. When an index has outperformed for an extended stretch, even modest negative catalysts, ranging from US pricing headlines to global risk aversion, can trigger a sharper than usual pullback as traders lock in gains.
Download the Univest iOS App or Univest Android App to track Nifty Pharma index levels and top pharma stock movers.
Pharma Sector Composition and Global Cues
India’s listed pharmaceutical universe spans generics exporters focused on the United States market, domestic branded formulation players, contract research and manufacturing specialists, and increasingly, biosimilars and specialty drug developers. Each of these sub segments reacts differently to global triggers, ranging from US Food and Drug Administration inspection outcomes and pricing pressure in the American generics market, to currency movements and raw material cost trends for active pharmaceutical ingredients sourced largely from China.
Global headlines around drug pricing policy in the United States, along with periodic volatility in the US dollar, have historically been meaningful swing factors for export oriented Indian pharma names. Today’s broad sector weakness, spanning large caps and mid caps alike, suggests that a macro or sentiment driven trigger, rather than a company specific development, was the dominant force behind the selling.
Nifty Pharma Index: Weekly and Monthly Trend
Despite today’s fall, the Nifty Pharma index is up 3.53 percent over the past month, even as it is now down 1.41 percent over the past week, a divergence that points to a sharp reversal in the last few sessions rather than a sustained multi week downtrend. Investors should watch whether the index stabilises around near term support levels or extends losses over the coming sessions before drawing conclusions about a broader trend change.
For investors with exposure to pharma mutual funds or direct holdings across constituents of the Nifty Pharma index, today’s move is a reminder to diversify within the sector across large cap, export focused and domestic formulation names, since dispersion between the best and worst performing stocks within the index was wide even on a single down day.
Frequently Asked Questions
Why is the Nifty Pharma index down today?
Ans. The Nifty Pharma index is down nearly 2 percent today on broad based selling across the sector, led by Gland Pharma, Piramal Pharma and Aurobindo Pharma, likely reflecting profit booking after a strong recent run.
What is the current Nifty Pharma index level?
Ans. The Nifty Pharma index was last at 25,636.20, down 1.75 percent on the day.
Which stocks are the top losers in the Nifty Pharma index today?
Ans. The top losers in the Nifty Pharma index today include Gland Pharma, down 4.27 percent, Piramal Pharma, down 3.56 percent, and Aurobindo Pharma, down 3.09 percent.
What is the one year return of the Nifty Pharma index?
Ans. The Nifty Pharma index has delivered a one year return of 14.92 percent despite today’s near 2 percent decline.
How has the Nifty Pharma index performed over the past week and month?
Ans. The Nifty Pharma index is down 1.41 percent over the past week but still up 3.53 percent over the past month, and up 12.82 percent year to date.
Is today’s Nifty Pharma index fall a buying opportunity?
Ans. This article does not constitute investment advice. Investors should assess individual stock fundamentals within the Nifty Pharma index and consult a SEBI registered investment advisor before investing.
Where can I track Nifty Pharma index and constituent stock prices live?
Ans. You can track live Nifty Pharma index levels and constituent stock movements on the Univest app and website.
Disclaimer: Data and figures in this article are sourced from publicly available information. These may or may not be accurate. Please verify all data with the official NSE (nseindia.com) and BSE (bseindia.com) websites before making any investment decision. Investments in securities are subject to market risk. This content is for educational purposes only and is not investment advice by Univest (SEBI RA INH000013776).
