
Godrej Industries (GODREJIND) Share Price Falls 2.13% as Large Cap Chemical Stock Trades at Rs 998.1
Updated: 21 Oct 2026 • 10:56 am
Posted by:
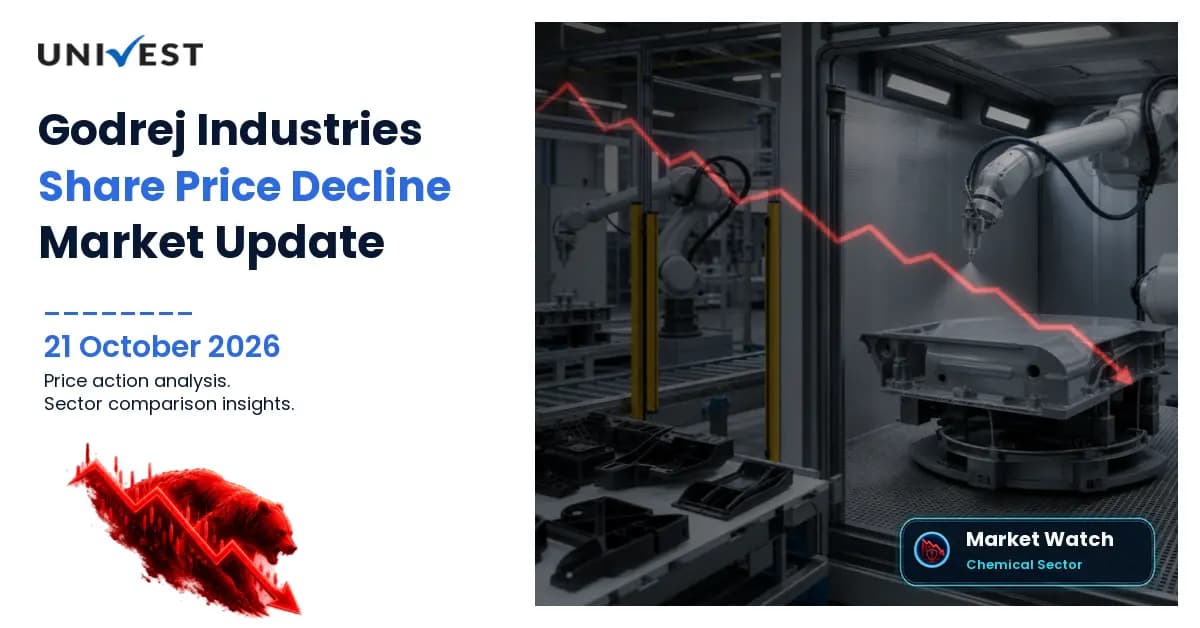
Godrej Industries Share Price is under attention after the stock declined 2.13% to Rs 998.1, with market capitalisation at Rs 34,353.75 crore. The move placed Godrej Industries Share Price below the previous close of Rs 1,019.85 and kept the company in focus in today’s chemical-sector news flow. The price move is confirmed in Univest data; a company-specific reason has not been established. The latest Univest figures also show that the stock traded between Rs 993.4 and Rs 1,020.8 during the morning session, which makes today’s Godrej Industries Share Price movement a clear intraday fall rather than a broad company rerating story. For readers tracking Godrej Industries Share Price Today, the important point is that the stock is moving in a large-cap context with valuation and peer comparison now carrying more weight than the short-term price move alone.
In Godrej Industries Share Price terms, the decline matters because it comes while the stock remains a large-cap chemical name with visible valuation metrics and a meaningful market presence. Univest data shows the price action without attaching a trigger, so the focus shifts to what the numbers say about relative valuation, profitability and sector positioning. Godrej Industries Share Price News therefore sits at the intersection of a same-day price fall and a broader fundamental review.
Godrej Industries (GODREJIND) Share Price Today: Price Action Analysis
| Metric | Value |
|---|---|
| Current Price | Rs 998.1 |
| Previous Close | Rs 1,019.85 |
| Today's Move | -Rs 21.75 (-2.13%) |
| Open | Rs 1,020.8 |
| High | Rs 1,020.8 |
| Low | Rs 993.4 |
| Market Capitalisation | Rs 34,353.75 crore |
| Market Cap Category | Large Cap |
Godrej Industries Share Price opened at Rs 1,020.8, touched a high of Rs 1,020.8 and a low of Rs 993.4, and was last traded at Rs 998.1 as of 21 October 2026 at 10:22:56 AM IST. The day change was Rs -21.75, or -2.13%, versus the previous close of Rs 1,019.85. That places Godrej Industries Share Price squarely in today’s price-fall category, with the move developing inside a narrow intraday range. The stock’s market capitalisation of Rs 34,353.75 crore also confirms its large-cap profile. In Godrej Industries Share Price Today terms, the session has shown a lower quote than the prior close, but the chart-free read is still a straightforward one: the stock is trading lower and has not yet reclaimed the previous session’s level. From here, the next layer of analysis is whether the fundamentals justify the current market valuation.
For Godrej Industries Share Price, the key price markers are simple and important: the stock began near the prior close, tested Rs 993.4 intraday and remained below Rs 1,000 at last trade. That keeps Godrej Industries Share Price in the day’s decliner set while leaving the broader question to fundamentals, sector context and peer positioning.
Godrej Industries (GODREJIND) Fundamental Analysis
| Metric | Value |
|---|---|
| Market Capitalisation | Rs 34,353.75 crore |
| P/E Ratio | 29.22x |
| P/B Ratio | 2.97x |
| ROE | 22.65% |
| ROCE | 10.64% |
| EPS | Rs 34.9 |
| Book Value Per Share | Rs 343.1 |
| Dividend Yield | 0% |
Godrej Industries (GODREJIND) fundamental metrics show P/E 29.22x, P/B 2.97x, ROE 22.65%, ROCE 10.64%. These ratios show where the company stands today and are not a call to buy or sell.
Godrej Industries has a market capitalisation of Rs 34,353.75 crore and falls in the Large Cap category, which gives readers a sense of company size before judging valuation. On valuation, P/E at 29.22x, P/B at 2.97x should be read against the sector and peer benchmarks rather than as a standalone signal. Profitability is represented by ROE of 22.65% and ROCE of 10.64%, helping investors compare shareholder returns and capital efficiency. According to latest Univest data, additional metrics include EPS of Rs 34.9, book value per share of Rs 343.1, dividend yield of 0%, adding context to earnings, balance-sheet value and historical payout. Against the latest Univest same industry benchmark, these figures can be compared with benchmark median P/E of 25.96x, median ROE of 7.98%, median ROCE of 10.08%. Together they describe the fundamental backdrop without implying a buy or sell view.
Sector and Industry Context
| Metric | Value |
|---|---|
| Sector | Chemicals |
| Industry | Chemicals |
| Benchmark Scope | same industry |
| Company P/E Ratio | 29.22x |
| Benchmark Median P/E | 25.96x |
| Benchmark Average P/E | 50.95x |
| Benchmark P/E Range | 3.92x to 907.61x |
| Company P/B Ratio | 2.97x |
| Benchmark Median P/B | 1.86x |
| Benchmark Average P/B | 3.13x |
| Company ROE | 22.65% |
| Benchmark Median ROE | 7.98% |
| Benchmark Average ROE | -3.34% |
| Company ROCE | 10.64% |
| Benchmark Median ROCE | 10.08% |
| Benchmark Average ROCE | 11.75% |
| Company Market Capitalisation | Rs 34,353.75 crore |
| Benchmark Median Market Cap | Rs 459.55 crore |
| Benchmark Average Market Cap | Rs 5,144.33 crore |
Godrej Industries (GODREJIND) operates in the Chemicals sector, within the Chemicals industry.
Godrej Industries (GODREJIND) has a P/E ratio of 29.22x, which is above the benchmark median of 25.96x, a difference of +12.56%. A P/E difference of this kind is a reference point rather than a recommendation.
Godrej Industries (GODREJIND) has a ROE of 22.65%, which is above the benchmark median of 7.98%, a difference of +183.83%. Godrej Industries (GODREJIND) has a ROCE of 10.64%, which is above the benchmark median of 10.08%, a difference of +5.56%.
Track stocks among today's decliners through the Univest top decliners screener. The peer table below provides the company-level comparison.
Peer Comparison
| Company | Symbol | Market Cap (Cr) | P/E | P/B | ROE (%) | ROCE (%) |
|---|---|---|---|---|---|---|
| Solar Industries India | SOLARINDS | 1,78,992.04 | 89.88 | 25.81 | 32.49 | 38.16 |
| Pidilite Industries | PIDILITIND | 1,50,952.3 | 56.99 | 13.06 | 24.29 | 32.38 |
| SRF | SRF | 71,800.02 | 33.21 | 4.86 | 13.8 | 14.21 |
| Gujarat Fluorochemicals | FLUOROCHEM | 48,899.18 | 79.51 | 6.09 | 7.65 | 9.58 |
| Navin Fluorine International | NAVINFLUOR | 41,841.77 | 52.98 | 9.96 | 20.24 | 21.39 |
Godrej Industries (GODREJIND) has a P/E ratio of 29.22x compared with the displayed peer median of 56.99x. This is a relative valuation comparison, not a buy or sell signal. Its ROE of 22.65% compares with a peer median of 20.24% across the companies shown in the table. ROCE stood at 10.64% versus the displayed peer median of 21.39%, providing a capital-efficiency comparison. Godrej Industries (GODREJIND) has a market capitalisation of Rs 34,353.75 crore. All 5 peers shown have a larger market capitalisation.
Why Investors Are Watching Godrej Industries
- Godrej Industries Share Price fell 2.13% to Rs 998.1, keeping the stock in today’s market movers list.
- Godrej Industries Share Price is trading with a market cap of Rs 34,353.75 crore, which keeps the large-cap context relevant.
- The stock’s P/E of 29.22 is above the chemical-sector median, so valuation remains part of the discussion.
- ROE of 22.65% is well above the sector median, which supports the fundamental analysis view.
- Godrej Industries Share Price is also being compared with peers such as Pidilite Industries, SRF and Solar Industries India
About Godrej Industries
Godrej Industries operates in the chemicals sector and belongs to the chemicals industry. The company is tracked in market commentary because Godrej Industries Share Price combines a large-cap profile with earnings and valuation metrics that are easy to compare against peers. In company overview terms, Godrej Industries Share Price reflects a business that sits inside a broader industrial ecosystem rather than a pure one-line story. For investors reading Godrej Industries Share Price News, the company’s appeal lies in its reported profitability metrics, book value, and its position inside a benchmark-heavy sector where peer comparison is especially useful.
The stock is therefore not only about today’s move; Godrej Industries Share Price is also about how the market values the company versus the chemicals peer set and the same-industry benchmark. That is why Godrej Industries Share Price appears in stock updates, market news and fundamental analysis screens.
Track Godrej Industries Share Price on Univest
Use Godrej Industries (GODREJIND) live share-price page, Univest top decliners screener, Univest market blogs to review live stock data, top decliners and related market analysis.
You can track Godrej Industries Share Price on Univest for live price updates, key valuation ratios, 52-week levels and market insights in one place. Univest also helps readers follow Godrej Industries Share Price Today alongside broader chemical-sector context, peer comparison and company fundamentals. For those watching Godrej Industries Share Price News, the platform keeps the numbers organised in a single place without speculation or prediction.
Disclaimer: Data and figures in this article are sourced from publicly available information. These may or may not be accurate. Please verify all data with the official NSE (nseindia.com) and BSE (bseindia.com) websites before making any investment decision. Investments in securities are subject to market risk. This content is for educational purposes only and is not investment advice by Uniresearch Global Pvt. Ltd. (Research Analyst, SEBI Reg. No. INH000013776, a subsidiary of Univest Communication Technologies Private Limited).
Frequently Asked Questions
Why is Godrej Industries Share Price falling today?
Ans. Godrej Industries Share Price fell 2.13% to Rs 998.1 versus the previous close of Rs 1,019.85. The price move is confirmed in Univest data; a company-specific reason has not been established.
What is Godrej Industries Share Price today?
Ans. Godrej Industries Share Price was last traded at Rs 998.1 as of 21 October 2026 at 10:22:56 AM IST. The stock moved between Rs 993.4 and Rs 1,020.8 during the session.
How much did Godrej Industries Share Price fall?
Ans. Godrej Industries Share Price declined by Rs 21.75, or 2.13%, from the previous close of Rs 1,019.85. That keeps the stock in today’s decline list without changing the broader company context.
What is the market capitalisation of Godrej Industries?
Ans. Godrej Industries has a market capitalisation of Rs 34,353.75 crore. In the chemicals sector, that places Godrej Industries Share Price well above the industry median market cap and within the large-cap category.
What does Godrej Industries Share Price valuation look like?
Ans. Godrej Industries Share Price is valued at a P/E of 29.22 and a P/B of 2.97. Both are above the chemicals sector median, so valuation remains an important part of the analysis.
How strong are the profitability metrics behind Godrej Industries Share Price?
Ans. Godrej Industries reports ROE of 22.65% and ROCE of 10.64%. ROE is well above the chemicals sector median, while ROCE is slightly above the benchmark median, supporting the fundamental view.
What is the EPS and book value for Godrej Industries?
Ans. Godrej Industries has EPS of Rs 34.9 and book value of Rs 343.1 per share. EPS reflects earnings per share, while book value shows the accounting net worth behind each share.
Does Godrej Industries Share Price offer a dividend yield?
Ans. Godrej Industries has a dividend yield of 0. That means the current Godrej Industries Share Price analysis is driven more by valuation and profitability metrics than by yield support. The previous close was Rs 1,019.85.
How does Godrej Industries compare with chemical peers?
Ans. Godrej Industries Share Price sits below Solar Industries India and Pidilite Industries on market cap, but above SRF and Gujarat Fluorochemicals on market cap, with a mid-range valuation profile.
Recent Articles
Cummins India Share Price Slips to Rs 4,005 Near Its 52-Week Low: Margins Squeezed by Commodity Costs While Price Hikes Take a Quarter to Flow Through
18 November 2026

V2 Retail Share Price Plunges 15% to a 52-Week Low of Rs 122.73 Then Rebounds to Close at Rs 141.61: What We Know, What We Do Not and the Numbers to Watch
18 November 2026

Infosys Share Price Falls to Rs 1,108.80, Down 25.4% in a Year: How India's IT Bellwether Lost a Quarter of Its Value and What Investors Should Check Next
18 November 2026

Nifty Bank 62,000: Index Closes at 62,038.65 After a Record 62,442.20, Up 24% From Its April Low as SBI Surges While HDFC Bank and Axis Bank Lag
18 November 2026
Note: This blog is for information purpose only. Investments and trading are subject to market risks, read all scheme related documents carefully.
Reviews






Recent Posts
Cummins India Share Price Slips to Rs 4,005 Near Its 52-Week Low: Margins Squeezed by Commodity Costs While Price Hikes Take a Quarter to Flow Through
V2 Retail Share Price Plunges 15% to a 52-Week Low of Rs 122.73 Then Rebounds to Close at Rs 141.61: What We Know, What We Do Not and the Numbers to Watch
Infosys Share Price Falls to Rs 1,108.80, Down 25.4% in a Year: How India's IT Bellwether Lost a Quarter of Its Value and What Investors Should Check Next
Nifty Bank 62,000: Index Closes at 62,038.65 After a Record 62,442.20, Up 24% From Its April Low as SBI Surges While HDFC Bank and Axis Bank Lag
Mahanadi Coalfields IPO Opens 19 November: Rs 129 to Rs 136 Price Band, Rs 8,981 Crore Offer for Sale and a Coal India Unit Valued at About 8.4 Times Earnings

Uniresearch Global Pvt Ltd
Research Analyst
SEBI Registration Number — INH000013776
Uniresearch is a subsidiary of Univest Communication Technologies Private Limited
Company Address: Registered Address: Ground Floor, Unitech Commercial Tower 2, Block B, Greenwood City, Unit 1-3, Sector 45, Gurugram, Haryana 122003
Write to us : support@univest.in, compliance@univest.in
Verify on SEBI registry →RESEARCH ANALYST
Get SEBI Registered
advice on the stocks
trending today.
Get 3 FREE Trade Ideas

for Startups Accelerator 2024

Trusted by 1Cr Indians

Awarded No.1 by Economic Times