
Dr. Reddy’s reported robust Q2FY23 numbers
Updated: 9 Nov 2022 • 11:10 am
Posted by:

Dr. Reddy’s Laboratories Ltd is a pharmaceutical company that manufactures and markets generic formulations, active pharmaceutical ingredients (APIs), biosimilars, and proprietary products. It has 13 formulation facilities, nine API manufacturing facilities, one biologics facility, and several R&D centres across the globe. The company on 28th October 2022 announced better than expected Q2FY23 numbers and has a market capital of Rs 74,233 crores. During Q2FY23, the company saw healthy growth across different segments, mainly driven by growth in the US market due to favourable currency impact and new launches. Post the results, brokerages have upgraded their rating on the stock after making a positive stance for the future prospects of the company. So, let’s now understand their Q2FY23 numbers in deeper detail and look for the possible investment opportunity in this healthcare stock.
Dr. Reddy’s results Q2FY23: Massive YoY growth in Europe business drove healthy performance
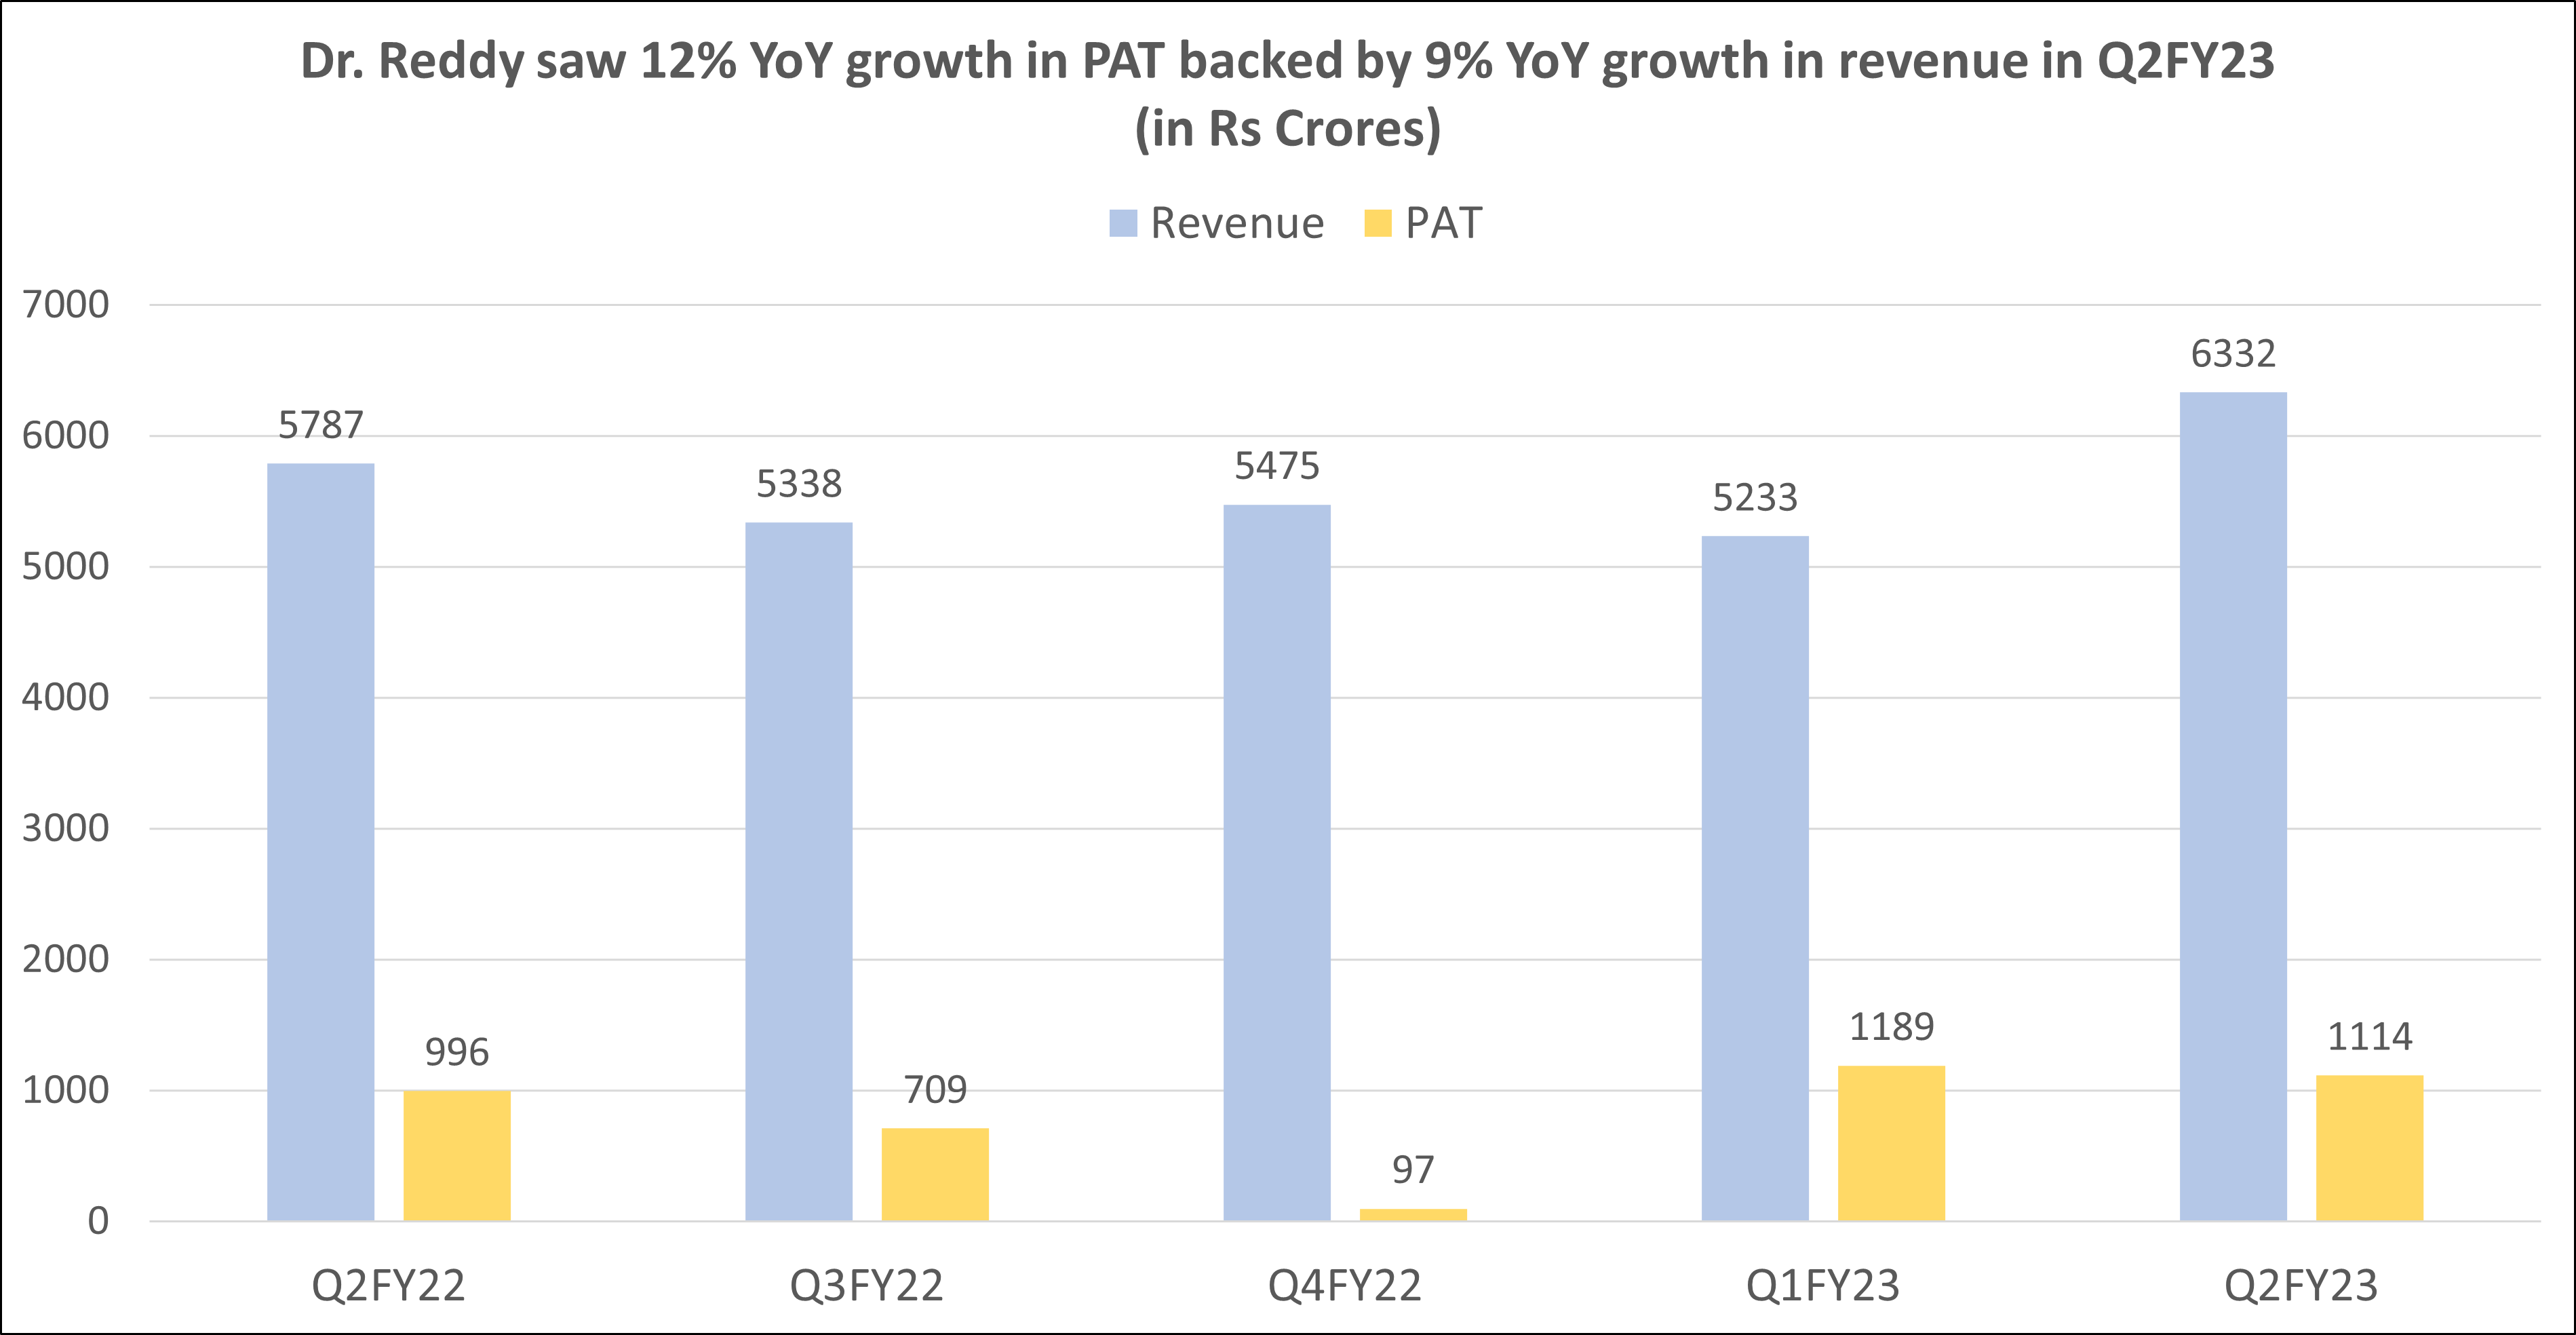
Dr. Reddy’s during Q2FY23 reported better-than-expected 12% YoY growth in consolidated net profit at Rs 1,113 crores against Rs 992 crores reported in Q2FY22. While the company saw a marginal fall of 6.3% QoQ in PAT from Rs 1,189 crores reported in Q1FY23.
Whereas the company also reported a 9% YoY increase in consolidated revenue at Rs 6,306 crores against revenue of Rs 5,763 crores in Q2FY22. Sequentially, consolidated revenue grew by 21% from Rs 5,233 crores in Q1FY23.
“We are pleased with the strong financial performance in the current quarter, driven by the launch of Lenalidomide capsules in the US market”, said GV Prasad, Co-Chairman and Managing Director.
Further, North America continues to be the largest contributor to the company’s revenues with a 44% share and was followed by emerging markets (19% share), India (18% share), PSAI (10%), Europe at 7% and others at 1% of the total revenue.
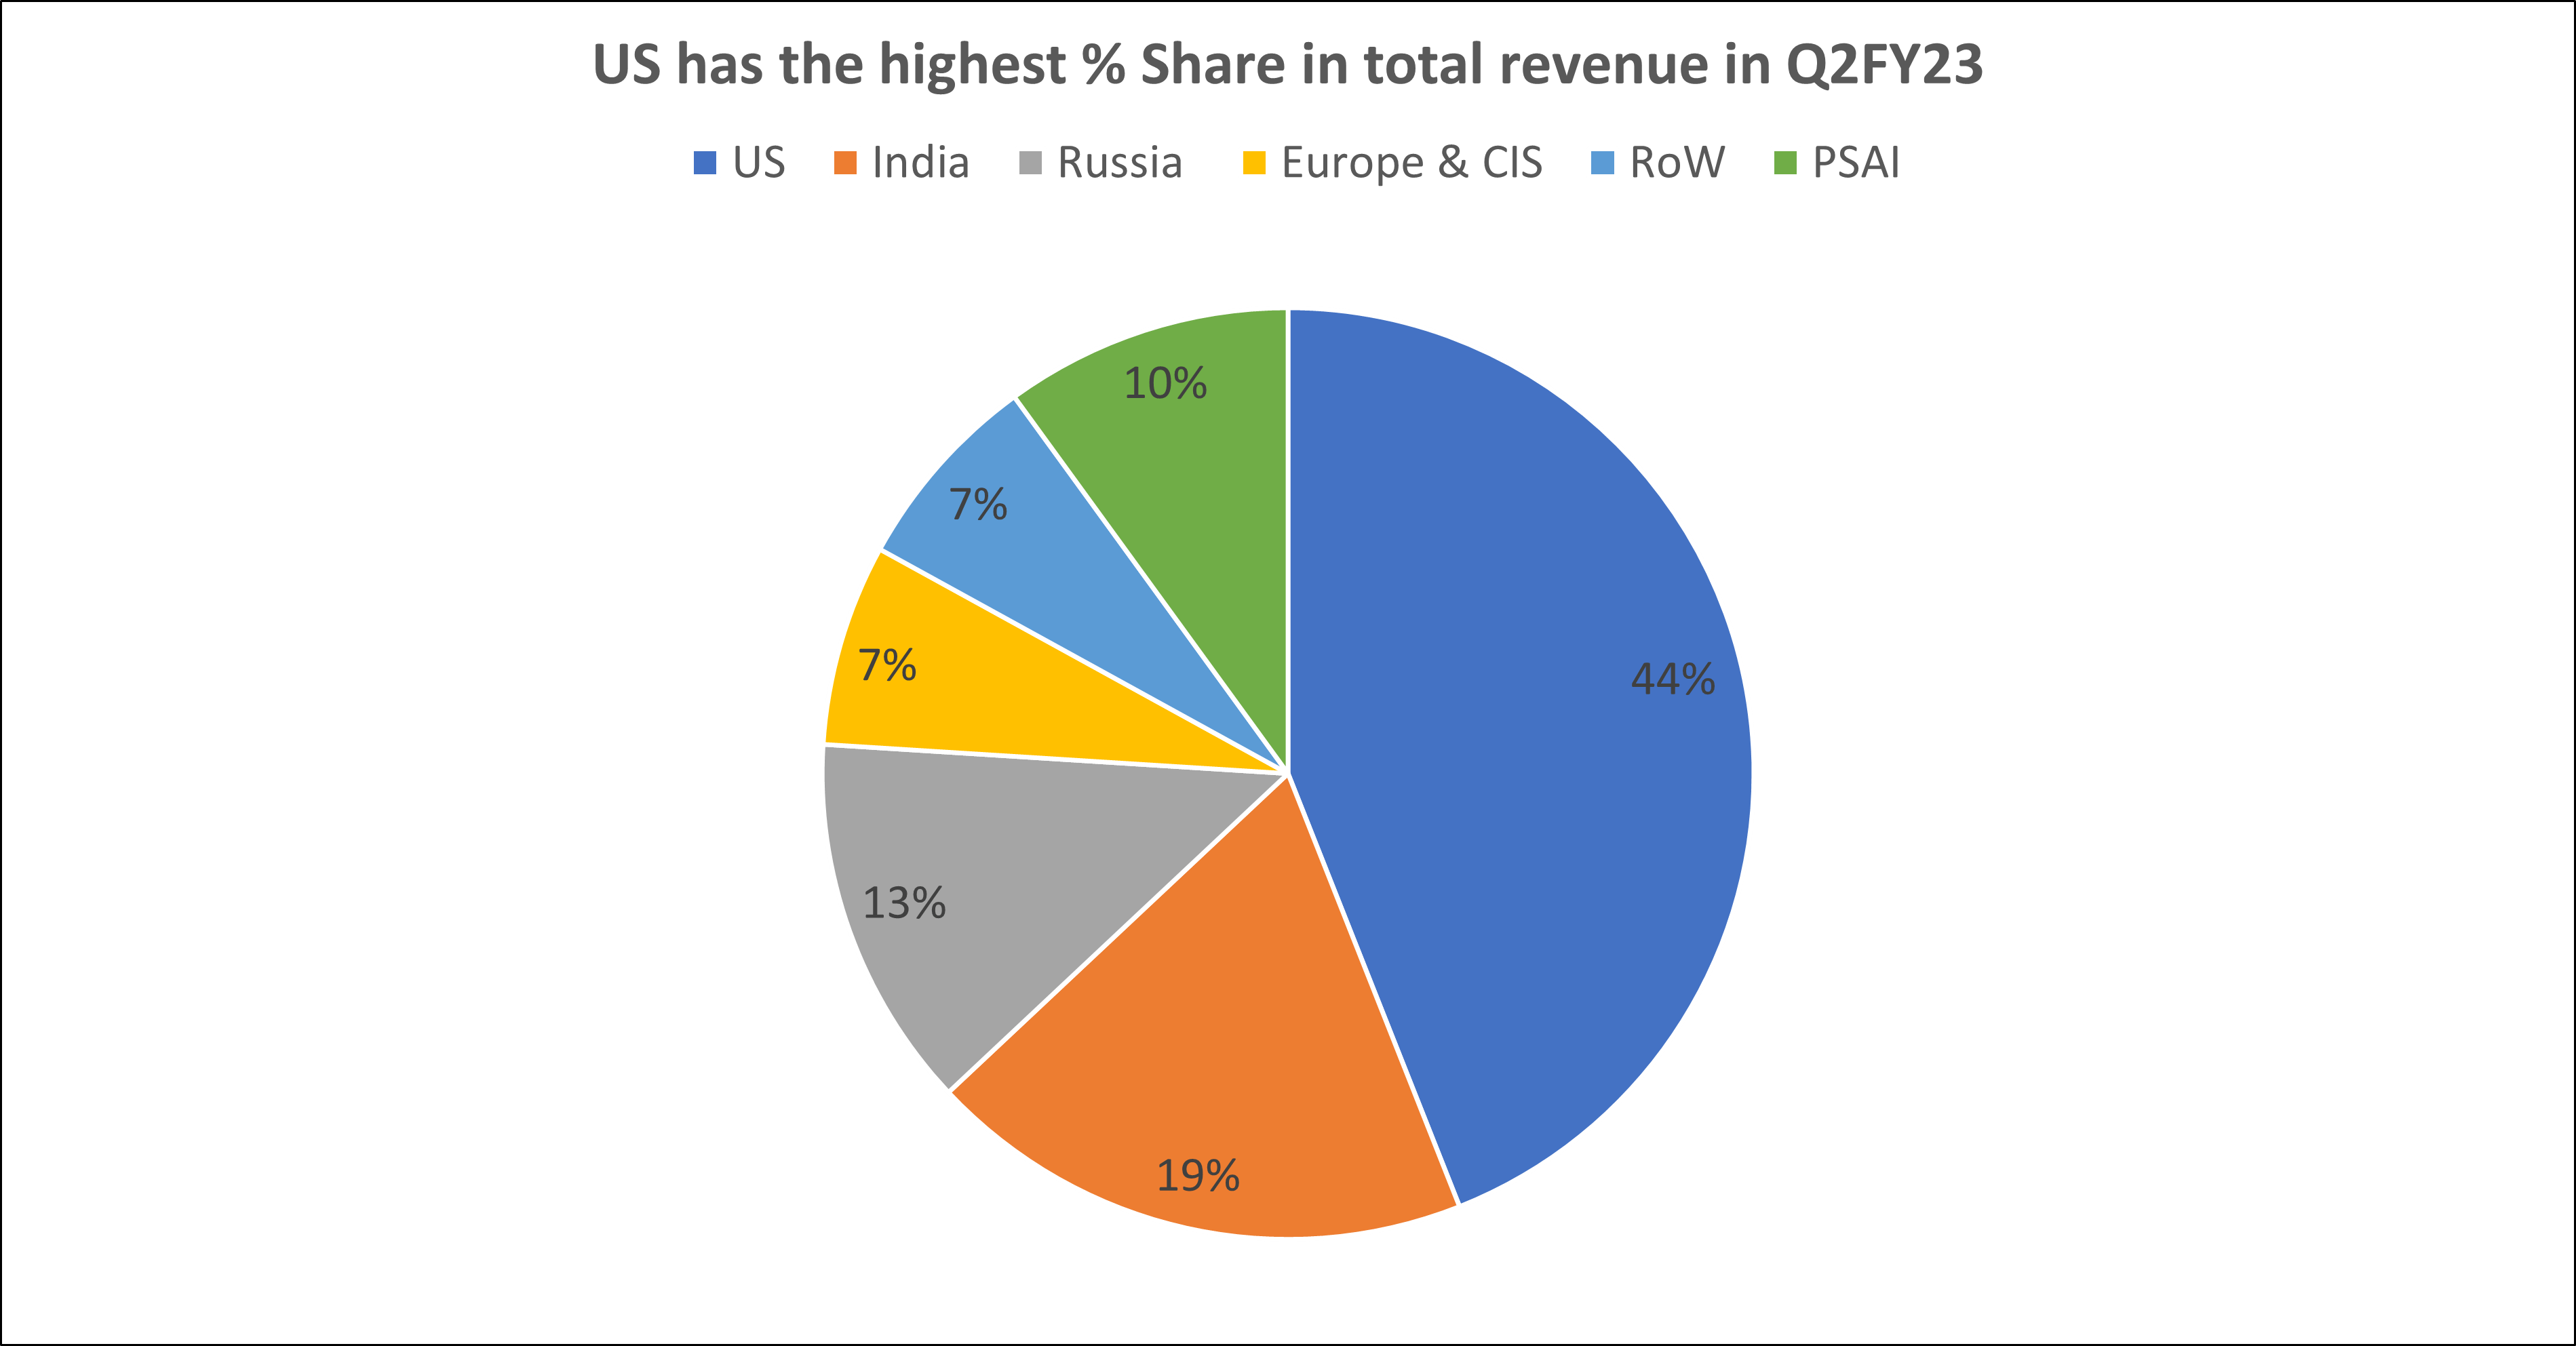
The company generated Rs 2,800 crore of its revenue from North America, with a YoY growth of 48% and a growth of 57% in the quarter. While the revenue from the Emerging Markets at Rs 1,225 crores was down 6% YoY but up 36% QoQ. Within Emerging markets, the sequential growth was driven by 85% growth in Russia and was primarily due to a lower sales base of Q1FY23. The rest of the world witnessed a sequential growth of 6%, driven by new product launches, partly offset by a reduction in base volumes and sales price of some of our products.
You may also like:
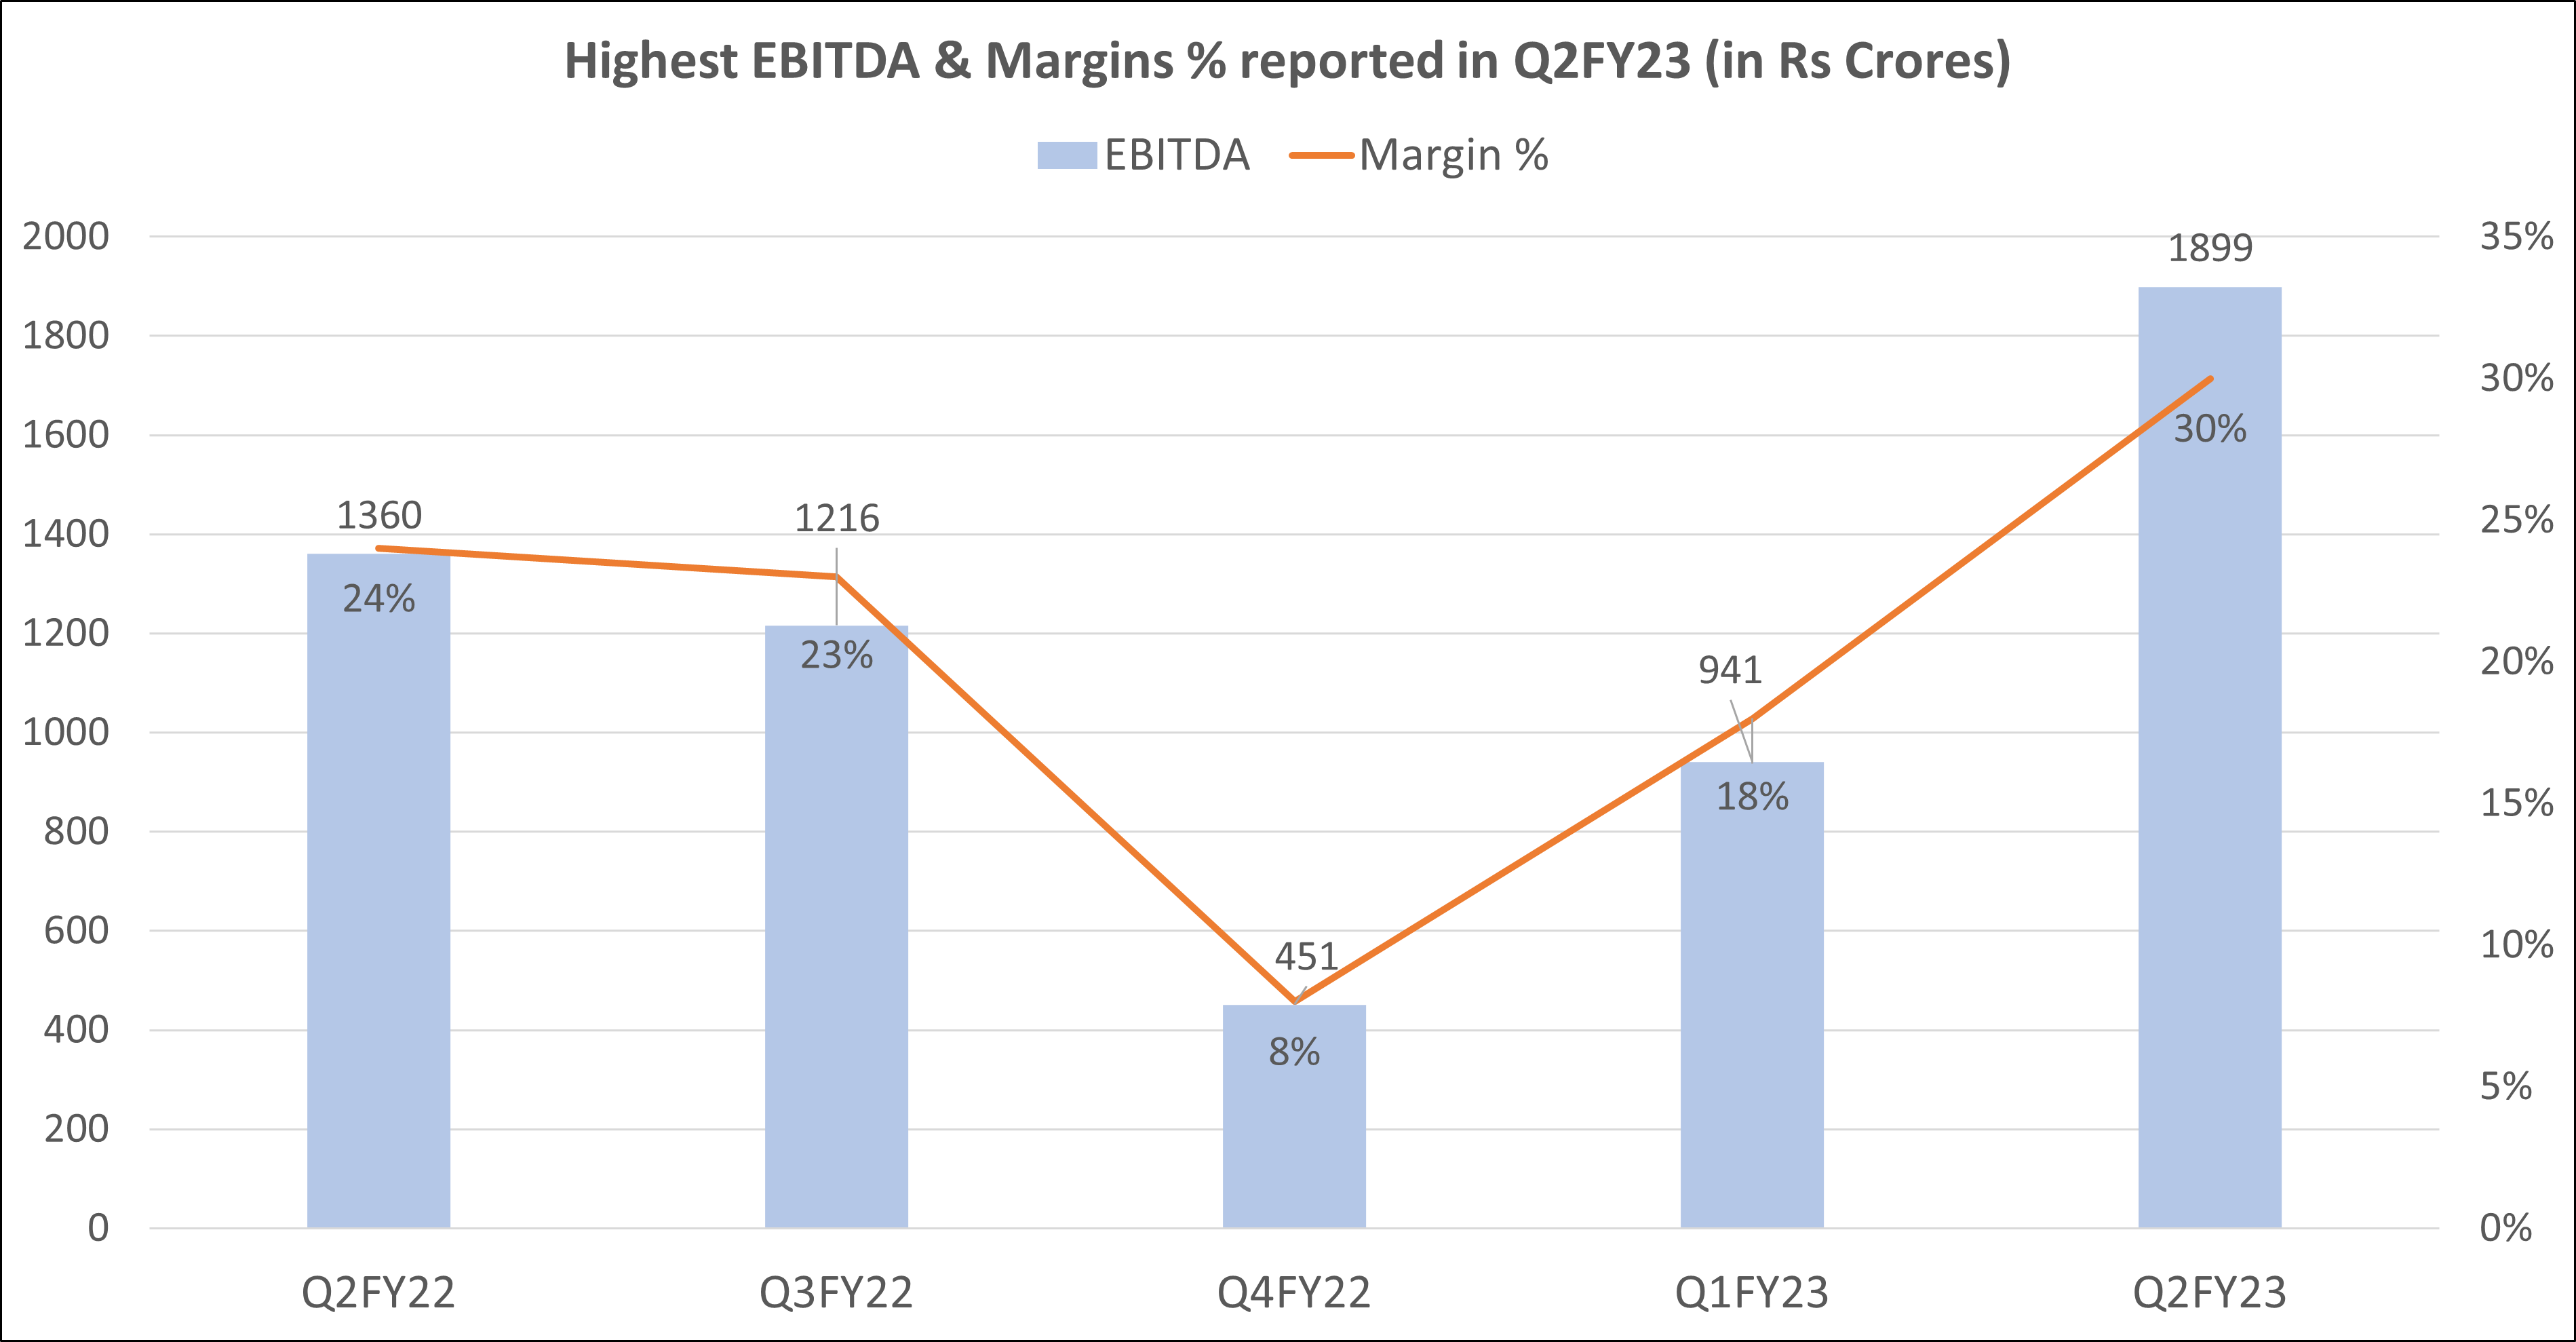
Dr. Reddy’s results Q2FY23: Highest EBITDA along with highest margin % at 30%
The gross margins for Q2FY23 were at 59.1% which was 570 basis points higher than 53.4% a year ago. The gross margin in Q1FY23 stood at 49.9%. They were mainly driven by product mix (including new products), and accruals related to the production-linked incentive scheme, which was partly offset by price erosion and provision made on inventory for Covid products.
Further, EBITDA margins grew 649 bps YoY to 30%. While absolute EBITDA came in at Rs 1,899 crores in Q2FY23, up 40% YoY from Rs 1,360 crores in Q2FY22 and 101% QoQ from Rs 941 crores in Q1FY23.
Lastly, the company incurred a CapEx of Rs 250 crore during the quarter.
Univest View along with Technical Analysis:
Dr. Reddy in Q2FY23 reported strong performance on the back of new launches during the quarter, especially gRevlimid. As a result, the company has exceeded analysts’ expectations for the quarter on the profitability front. On the revenue side, the US sales saw robust growth, while few regions were impacted due to last year’s high base. Further, the company will actively look for new investment avenues for growth across all the business segments. Therefore, margins are to see some pressure due to increased R&D and marketing activities and investment in biosimilar & injectable product pipelines.
While coming onto technical analysis, Dr. Reddy’s stock can be moving in a sideways trend with a 50 EMA line above 100 EMA but below the 200 EMA line. At the start of 2022, the company experienced a steep correction but with their margin pressure bottoming out in Q1FY23, the situation seems favourable now. Post the announcement of Q2FY23 results the company’s share price was seen making a small up move. While the brokerages have upgraded their ratings for the company, the share price is expected to break from its July peak, as it continues to take support at 4066.
ABOUT THE AUTHOR
Ketan Sonalkar (SEBI Rgn No INA000011255
Ketan Sonalkar is a certified SEBI registered investment advisor and head of research at Univest. He is one of the finest financial trainers, with a track record of having trained more than 2000 people in offline and online models. He serves as a consultant advisor to leading fintech and financial data firms. He has over 15 years of working experience in the finance field. He runs Advisory Services for Direct Equities and Personal Finance Transformation.
Note – This channel is for educational and training purpose only & any stock mentioned here should not be taken as a tip/recommendation/advice
You may also like: Sun Pharma results
Recent Articles
Note: This blog is for information purpose only. Investments and trading are subject to market risks, read all scheme related documents carefully.
Reviews


Recent Posts
3 Renewable EPC Stocks Beyond Pure Generation
3 Organic Food Products Stocks
3 Defence Electronics Export Stocks
3 Offshore Wind Energy Stocks in India
3 Chip Design and EDA Services Stocks
Popular this week
3 Renewable EPC Stocks Beyond Pure Generation
3 Organic Food Products Stocks
3 Defence Electronics Export Stocks
3 Offshore Wind Energy Stocks in India
3 Chip Design and EDA Services Stocks

Uniresearch Global Pvt Ltd
Research Analyst
SEBI Registration Number — INH000013776
Uniresearch is a subsidiary of Univest Communication Technologies Private Limited
Company Address: Registered Address: Ground Floor, Unitech Commercial Tower 2, Block B, Greenwood City, Unit 1-3, Sector 45, Gurugram, Haryana 122003
Write to us : support@univest.in, compliance@univest.in
Verify on SEBI registry →RESEARCH ANALYST
Get SEBI Registered
advice on the stocks
trending today.
Get 3 FREE Trade Ideas
for Startups Accelerator 2024
Trusted by 1Cr Indians
Awarded No.1 by Economic Times