
HY-TECH ENGINEERS LIMITED (HTEL) Share Price Near 52-Week Low as HTEL Falls 6.55%
- September 17, 2026
- Posted by: Harsh Piplani
- Category: News
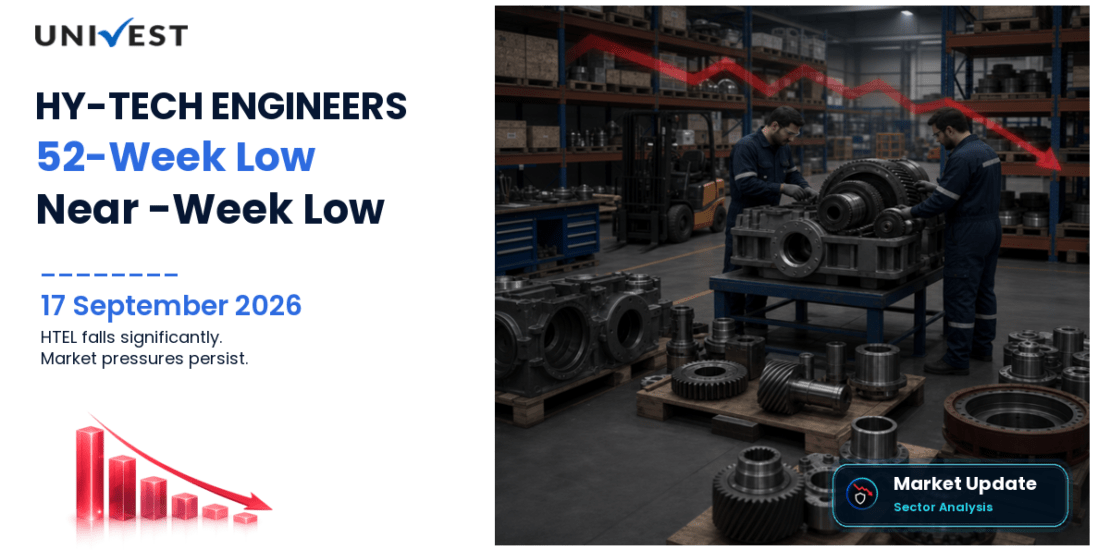
HTEL Share Price moved to Rs 69.25 on 17 September 2026, down 6.55% from the previous close, while staying close to its 52-week low and carrying a market capitalisation of Rs 771.34 crore. The session kept HY-TECH ENGINEERS LIMITED in focus for traders tracking HTEL Share Price Today, especially because the move was sharp enough to place the stock back in the yearly low conversation without implying a fresh low was set. The verified data confirms the price event, but it does not establish a company-specific catalyst. For readers following HTEL Stock News, the key point is that price action, valuation and sector positioning now matter more than any unverified narrative. Univest’s AI summary flags this as a stock to watch on price behaviour, support zones and relative valuation. HTEL Share Price therefore enters the market discussion as a near 52-week low case study rather than a headline driven by a disclosed event.
HTEL Share Price Today: Price Action Analysis
| Metric | Value |
|---|---|
| Current Price | Rs 69.25 |
| Previous Close | Rs 74.1 |
| Today's Move | Rs -4.85 (-6.55%) |
| Open | Rs 74.31 |
| High | Rs 76.8 |
| Low | Rs 68.5 |
| Turnover | Rs 1.89 crore |
| Market Capitalisation | Rs 771.34 crore |
HY-TECH ENGINEERS LIMITED (HTEL) traded at Rs 69.25 versus the previous close of Rs 74.1, a fall of 6.55%. The stock opened at Rs 74.31, reached a high of Rs 76.8, touched a low of Rs 68.5.
HTEL Share Price Today shows a weak session with Rs 69.25 against the previous close of Rs 74.10, leaving the stock down Rs 4.85 or 6.55%. The day opened at Rs 74.31, touched a high of Rs 76.80 and a low of Rs 68.50, which shows that selling pressure quickly dragged the price back toward the lower end of the range. Turnover stood at Rs 1.89 crore, while market capitalisation was Rs 771.34 crore. Since the stock is trading near its 52-week low, the latest price action is more about how buyers and sellers are reacting around support than about any confirmed fresh trigger. In HTEL Stock News terms, the move places HTEL Share Price squarely in the stocks at 52 week low and top losers today conversation on market news dashboards. The next area to monitor is whether HTEL Share Price can stabilise after the steep intraday swing, which also sets up the technical read for Univest users who track stock updates and price action closely.
HY-TECH ENGINEERS LIMITED (HTEL) Fundamental Analysis
| Metric | Value |
|---|---|
| Market Capitalisation | Rs 771.34 crore |
| P/E Ratio | 31.11x |
| P/B Ratio | 3.86x |
| ROE | 20.24% |
| ROCE | 23.96% |
| EPS | Rs 2.38 |
| Book Value Per Share | Rs 19.19 |
| Dividend Yield | 0.54% |
HY-TECH ENGINEERS LIMITED (HTEL) fundamental metrics show P/E 31.11x, P/B 3.86x, ROE 20.24%, ROCE 23.96%. These figures provide context only and are not a buy or sell signal.
HY-TECH ENGINEERS LIMITED has a market capitalisation of Rs 771.34 crore, which gives readers a sense of company size before judging valuation. On valuation, P/E at 31.11x, P/B at 3.86x should be read against the sector and peer benchmarks rather than as a standalone signal. Profitability is represented by ROE of 20.24% and ROCE of 23.96%, helping investors compare shareholder returns and capital efficiency. Additional supplied metrics include EPS of Rs 2.38, book value per share of Rs 19.19, dividend yield of 0.54%, adding context to earnings, balance-sheet value and historical payout. Against the supplied same industry benchmark, these figures can be compared with benchmark median P/E of 25.62x, median ROE of 13.59%, median ROCE of 15.79%. These numbers explain the fundamental backdrop without converting the article into a buy or sell view.
Sector and Industry Context
| Metric | Value |
|---|---|
| Sector | Capital Goods |
| Industry | Engineering – Industrial Equipments |
| Benchmark Scope | same industry |
| Company P/E Ratio | 31.11x |
| Benchmark Median P/E | 25.62x |
| Benchmark Average P/E | 68.73x |
| Benchmark P/E Range | 0x to 4,337.11x |
| Company P/B Ratio | 3.86x |
| Benchmark Median P/B | 2.73x |
| Company ROE | 20.24% |
| Benchmark Median ROE | 13.59% |
| Company ROCE | 23.96% |
| Benchmark Median ROCE | 15.79% |
| Company Market Capitalisation | Rs 771.34 crore |
| Benchmark Median Market Cap | Rs 339.26 crore |
HY-TECH ENGINEERS LIMITED (HTEL) is classified under sector: Capital Goods and industry: Engineering – Industrial Equipments.
HY-TECH ENGINEERS LIMITED (HTEL) has a P/E ratio of 31.11x, which is above the benchmark median of 25.62x, a difference of +21.43%. P/E is a valuation multiple and is not, by itself, a buy or sell signal.
HY-TECH ENGINEERS LIMITED (HTEL) has a ROE of 20.24%, which is above the benchmark median of 13.59%, a difference of +48.93%. HY-TECH ENGINEERS LIMITED (HTEL) has a ROCE of 23.96%, which is above the benchmark median of 15.79%, a difference of +51.74%.
Track stocks falling to yearly lows through the Univest 52-week-low screener. The peer table below provides the company-level comparison.
Peer Comparison
| Company | Symbol | Market Cap (Cr) | P/E | P/B | ROE (%) | ROCE (%) |
|---|---|---|---|---|---|---|
| LT Elevator Ltd. | LTELEVATOR | 762.6 | 78.19 | 5.66 | 24.68 | 30.36 |
| Bajaj Steel Industries Ltd. | BAJAJST | 758.37 | 25.08 | 1.73 | 23.44 | 27.95 |
| Lokesh Machines Ltd. | LOKESHMACH | 754.28 | 170.88 | 2.88 | 0.27 | 4.87 |
| Pradeep Metals Ltd. | PRADPME | 813.85 | 23.41 | 4.49 | 20.13 | 21.1 |
| TANKUP ENGINEERS LIMITED | TANKUP | 839.1 | 175.65 | 104.22 | 29.74 | 21.26 |
HY-TECH ENGINEERS LIMITED (HTEL) has a P/E ratio of 31.11x compared with the displayed peer median of 78.19x. This is a relative valuation comparison, not a buy or sell signal. Its ROE of 20.24% compares with a peer median of 23.44% across the companies shown in the table. ROCE stood at 23.96% versus the displayed peer median of 21.26%, providing a capital-efficiency comparison. HY-TECH ENGINEERS LIMITED (HTEL) has a market capitalisation of Rs 771.34 crore. Among the 5 peers shown, 2 have a larger market capitalisation.
Why Investors Are Watching HTEL
- HTEL Share Price is trading close to its 52-week low, keeping price action and support level tracking in focus.
- The session showed a sharp fall from the previous close, which places HTEL Share Price Today among the weaker market updates.
- ROE of 20.24% and ROCE of 23.96% give HTEL Fundamental Analysis a stronger return profile than many industrial peers.
- P/E of 31.11 and P/B of 3.86 make HTEL Share Price a valuation comparison point within Capital Goods.
- Univest users may watch whether HTEL Stock News continues to reflect selling pressure or a calmer trading range.
About HY-TECH ENGINEERS LIMITED
HY-TECH ENGINEERS LIMITED operates in the Capital Goods sector and the Engineering – Industrial Equipments industry. The company’s market position is best read through its industrial equipment context, where business performance tends to reflect project execution, product demand and operating efficiency. On the supplied figures, HTEL Share Price is linked to a company with a market capitalisation of Rs 771.34 crore, EPS of Rs 2.38 and book value of Rs 19.19, which gives investors a simple lens on earnings and asset backing. Its dividend yield of 0.54% suggests that the stock is not being viewed primarily as an income play. For readers tracking HTEL Company News, the relevant story is not only the daily price movement but also how the business sits within an industry where valuation, margins and return ratios matter. Univest presents HTEL Share Price as a stock whose business profile should be read alongside sector benchmark data and peer comparisons rather than in isolation.
Track HTEL Share Price on Univest
Use HY-TECH ENGINEERS LIMITED (HTEL) live share-price page, Univest 52-week-low screener, Univest market blogs to review live stock data, yearly-low lists and related market analysis.
Investors can track HTEL Share Price on Univest for live share price updates, key technical indicators, fundamental ratios, shareholding pattern, 52-week levels and market insights. HTEL Share Price Today, HTEL Stock News and HTEL Latest News can all be reviewed in one place with a cleaner view of price action and sector context. Univest also helps readers compare HTEL Share Price with peer valuations, return ratios and market capitalisation, which makes the stock analysis more practical for screen-based monitoring. If you are following HTEL Share Price Live or checking HTEL Share Price Update after a sharp move, Univest keeps the data organised around the same company, sector and benchmark framework.
Disclaimer: Data and figures in this article are sourced from publicly available information. These may or may not be accurate. Please verify all data with the official NSE (nseindia.com) and BSE (bseindia.com) websites before making any investment decision. Investments in securities are subject to market risk. This content is for educational purposes only and is not investment advice by Univest (SEBI RA INH000013776).
Frequently Asked Questions
Why is HTEL Share Price falling today?
Ans. HTEL Share Price fell 6.55% to Rs 69.25, but the supplied data does not establish a company-specific catalyst. The move is clear in price action, and it keeps the stock near its 52-week low zone.
What is the current HTEL Share Price Today?
Ans. HTEL Share Price Today is Rs 69.25. The stock closed previously at Rs 74.10, opened at Rs 74.31 and moved between Rs 68.50 and Rs 76.80 during the session. The stock moved -6.55% during the session.
Is HTEL trading near its 52-week low?
Ans. Yes. HTEL Share Price is trading close to its 52-week low, which places it in the yearly low conversation. The event is based on near-low price action, not on a claim of a fresh low.
How is HTEL valued on earnings and book value?
Ans. HTEL Share Price reflects a P/E of 31.11 and P/B of 3.86. EPS is Rs 2.38 and book value is Rs 19.19, so investors can compare the stock’s valuation against sector and peer benchmarks.
What do HTEL’s ROE and ROCE show?
Ans. HTEL reports ROE of 20.24% and ROCE of 23.96%. Those figures suggest healthy return generation versus the industry medians, which is useful context when reviewing HTEL Share Price alongside its recent weakness.
How does HTEL compare with peers?
Ans. HTEL Share Price sits in a peer group with similar market caps, but its P/E and P/B are above some comparables and below others. ROE and ROCE remain competitive within the same industry set.
What should investors monitor next in HTEL Stock News?
Ans. Investors should monitor whether HTEL Share Price stabilises after the steep fall, how it behaves near support, and whether valuation stays justified by ROE, ROCE, EPS and peer positioning within Capital Goods.
