
Yasho Industries (YASHO) Share Price Falls 5.05% to Rs 3,980: Price Action, Valuation and Sector View
- September 15, 2026
- Posted by: Harsh Piplani
- Category: News
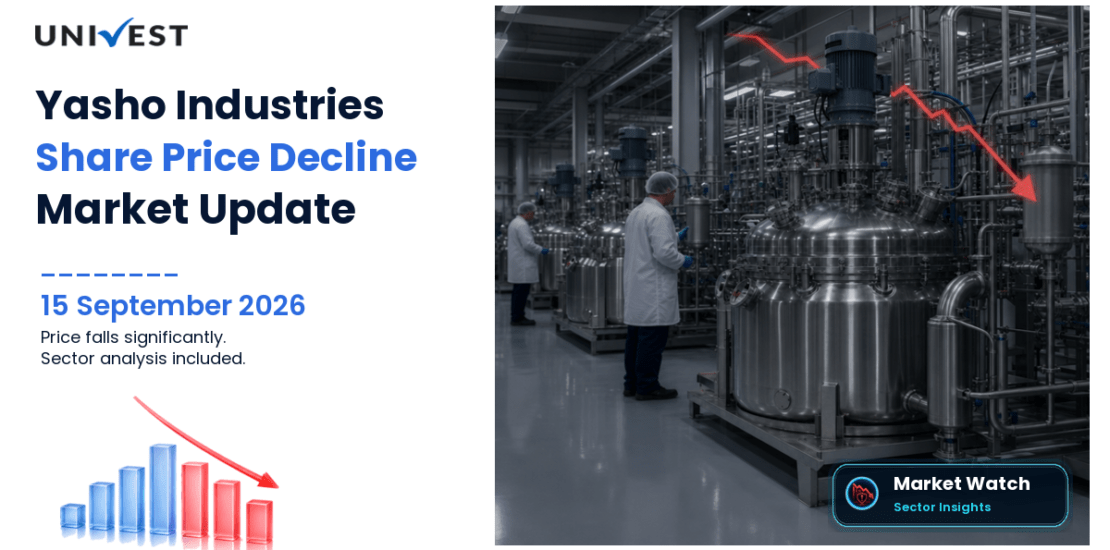
Yasho Industries Share Price fell to Rs 3,980 on 15 September 2026, down 5.05% for the day. The company’s market capitalisation stood at Rs 5,053.97 crore. In intraday trade, the Mid Cap chemicals stock opened at Rs 4,241, moved up to Rs 4,255.15, and later declined to the day’s low of Rs 3,980.
For readers tracking the stock today, the supplied data confirms a same-day decline of Rs 211.70 from the previous close of Rs 4,191.70. However, the data does not identify any company-specific catalyst behind the move. That means the session is best understood through the verified price action, technical position, valuation ratios and comparison with the broader Chemicals industry.
Yasho Industries (YASHO) Share Price Today: Price Action Analysis
| Metric | Value |
|---|---|
| Current Price | Rs 3,980 |
| Previous Close | Rs 4,191.7 |
| Today's Move | -Rs 211.70 (-5.05%) |
| Open | Rs 4,241 |
| High | Rs 4,255.15 |
| Low | Rs 3,980 |
| Turnover | Rs 0.67 crore |
| Market Capitalisation | Rs 5,053.97 crore |
| Market Cap Category | Mid Cap |
Yasho Industries Share Price Today reflects a session that weakened through the day. The stock opened above the previous close, briefly traded higher, and then finished at the intraday low. That pattern indicates that the pressure persisted rather than easing into the close.
The stock is also trading below its 50-day moving average of Rs 4,250.61, while staying well above its 200-day moving average of Rs 2,592.58. Its RSI stands at 53.98, which is broadly neutral on the supplied data. Put together, those numbers show near-term weakness in price relative to the 50-DMA, but not an extreme momentum reading on RSI.
Yasho Industries (YASHO) Fundamental Analysis
| Metric | Value |
|---|---|
| Market Capitalisation | Rs 5,053.97 crore |
| P/E Ratio | 87.64x |
| P/B Ratio | 10.53x |
| ROE | 5.85% |
| ROCE | 9.06% |
| EPS | Rs 47.83 |
| Book Value Per Share | Rs 398.08 |
| Dividend Yield | 0.01% |
Yasho Industries Share Price is drawing added attention because the company trades at elevated valuation multiples relative to its current return ratios. On the supplied numbers, the stock is valued at 87.64 times earnings and 10.53 times book value.
EPS stands at Rs 47.83 and book value per share at Rs 398.08. The dividend yield is 0.01%, indicating a very small payout relative to the market price. Profitability metrics are more moderate: ROE is 5.85% and ROCE is 9.06%. In simple terms, the market is assigning a premium multiple to a business whose current return ratios are not especially high in absolute terms.
That does not, by itself, explain today’s decline, but it does help frame why the stock is being watched closely after a sharp session. When a company trades on richer earnings and book-value multiples, market participants often compare that premium with current profitability and with sector peers.
Sector and Industry Context
| Metric | Value |
|---|---|
| Sector | Chemicals |
| Industry | Chemicals |
| Benchmark Scope | same industry |
| Company P/E Ratio | 87.64x |
| Benchmark Median P/E | 26.69x |
| Benchmark Average P/E | 50.78x |
| Benchmark P/E Range | 4.56x to 760.7x |
| Company P/B Ratio | 10.53x |
| Benchmark Median P/B | 1.95x |
| Benchmark Average P/B | 2.27x |
| Company ROE | 5.85% |
| Benchmark Median ROE | 7.68% |
| Benchmark Average ROE | -2.93% |
| Company ROCE | 9.06% |
| Benchmark Median ROCE | 9.84% |
| Benchmark Average ROCE | 18.15% |
| Company Market Capitalisation | Rs 5,053.97 crore |
| Benchmark Median Market Cap | Rs 472.86 crore |
| Benchmark Average Market Cap | Rs 5,418.35 crore |
The Chemicals industry benchmark covers 181 same-industry companies and provides useful context for Yasho Industries Share Price. Against that set, Yasho’s P/E of 87.64 is above the median of 26.69 and the average of 50.78. Its P/B of 10.53 is also well above the industry median of 1.95 and average of 2.27.
Profitability looks more mixed. ROE of 5.85% is below the benchmark median of 7.68%, though above the benchmark average of -2.93%. ROCE of 9.06% is below both the median of 9.84% and the average of 18.15%. In size terms, the company’s market capitalisation of Rs 5,053.97 crore is far above the sector median of Rs 472.86 crore and slightly below the average of Rs 5,418.35 crore.
This combination suggests a larger-than-median listed chemicals company that is currently valued at a premium to broad industry central tendencies, while its return ratios remain below sector medians on the supplied data.
Peer Comparison
| Company | Symbol | Market Cap (Cr) | P/E | P/B | ROE (%) | ROCE (%) |
|---|---|---|---|---|---|---|
| Solar Industries India | SOLARINDS | 2,01,860.69 | 101.37 | 29.11 | 32.49 | 38.16 |
| Pidilite Industries | PIDILITIND | 1,59,547.55 | 60.23 | 13.8 | 24.29 | 32.38 |
| SRF | SRF | 73,602.28 | 34.05 | 4.99 | 13.8 | 14.21 |
| Gujarat Fluorochemicals | FLUOROCHEM | 52,417.67 | 85.23 | 6.53 | 7.65 | 9.58 |
| Navin Fluorine International | NAVINFLUOR | 43,822.77 | 55.49 | 10.44 | 20.24 | 21.39 |
Peer data shows the company sits between higher-multiple specialty names and lower-multiple diversified chemicals players, but its profitability is weaker than several of the larger listed peers shown here.
Compared with Solar Industries India, Yasho trades at a lower P/E of 87.64 versus 101.37, but Solar’s ROE and ROCE are much stronger at 32.49% and 38.16%. Pidilite trades at a lower P/E of 60.23 and a higher P/B of 13.8, while also posting materially stronger returns. SRF combines a lower P/E of 34.05 and P/B of 4.99 with better ROE and ROCE than Yasho.
Among closer valuation references, Gujarat Fluorochemicals trades at a P/E of 85.23 and P/B of 6.53, with ROE of 7.65% and ROCE of 9.58%, both slightly above Yasho’s figures. Navin Fluorine trades at 55.49 times earnings and 10.44 times book value, with substantially stronger ROE of 20.24% and ROCE of 21.39%.
Why Investors Are Watching the Stock
- Sharp daily move: Yasho Industries Share Price declined 5.05% to Rs 3,980, a drop of Rs 211.70 from the previous close.
- Intraday reversal: The stock opened at Rs 4,241, moved up to Rs 4,255.15 and later fell to the session low.
- Technical setup: Price is below the 50-DMA of Rs 4,250.61 but above the 200-DMA of Rs 2,592.58, while RSI is 53.98.
- Premium valuation: The stock trades at 87.64x earnings and 10.53x book value despite ROE of 5.85% and ROCE of 9.06%.
- Sector gap: Its P/E and P/B are above Chemicals industry medians, making benchmark and peer checks especially relevant.
About Yasho Industries
Yasho Industries operates in the Chemicals sector and Chemicals industry. Based on the supplied classification, it belongs to a listed peer universe where investors often compare valuation multiples, return ratios and market capitalisation across specialty and industrial chemicals businesses.
With a market capitalisation of Rs 5,053.97 crore, the company is classified as Mid Cap. In the current session, the main focus remains the combination of a sharp single-day decline, premium valuation multiples and a profitability profile that is moderate relative to several sector benchmarks.
Track Yasho Industries Share Price on Univest
UseYasho Industries (YASHO) live share-price page,Univest top decliners screener,Univest market blogsto review live stock data, top decliners and related market analysis.
You can track Yasho Industries Share Price on Univest for live price moves, technical indicators, fundamental ratios, shareholding updates when available and broader market context.
Disclaimer: Data and figures in this article are sourced from publicly available information. These may or may not be accurate. Please verify all data with the official NSE (nseindia.com) and BSE (bseindia.com) websites before making any investment decision. Investments in securities are subject to market risk. This content is for educational purposes only and is not investment advice by Univest (SEBI RA INH000013776).
Frequently Asked Questions
Why did Yasho Industries shares fall today?
Ans. The stock fell 5.05% to Rs 3,980 from the previous close of Rs 4,191.70. The supplied data confirms the decline and the intraday reversal, but it does not identify a company-specific catalyst.
What is Yasho Industries Share Price Today?
Ans. Yasho Industries Share Price Today is Rs 3,980. The stock was down by Rs 211.70, or 5.05%, after opening at Rs 4,241 and touching an intraday high of Rs 4,255.15.
What does today’s price action indicate?
Ans. The session showed an early push higher followed by steady weakness. The stock opened above the previous close, traded up briefly, and then finished at the day’s low of Rs 3,980.
Is the stock expensive compared with the Chemicals sector?
Ans. On the supplied numbers, it appears richly valued versus the same-industry benchmark. Its P/E of 87.64 is above the median of 26.69 and average of 50.78, while its P/B of 10.53 is above the median of 1.95 and average of.
How profitable is the company based on current ratios?
Ans. ROE stands at 5.85% and ROCE at 9.06%. Both figures indicate moderate profitability on the supplied data, and both are below the Chemicals industry medians of 7.68% for ROE and 9.84% for ROCE.
What do EPS, book value and dividend yield show?
Ans. The company reports EPS of Rs 47.83, book value of Rs 398.08 per share and dividend yield of 0.01%. These indicate current earnings per share, accounting net worth per share and a very low payout yield.
How does Yasho compare with listed peers?
Ans. Its P/E of 87.64 is close to Gujarat Fluorochemicals at 85.23, above Navin Fluorine at 55.49 and far above SRF at 34.05. Its ROE and ROCE are lower than several larger chemicals peers shown in the comparison table.
What is the market capitalisation of Yasho Industries?
Ans. Yasho Industries Market Cap stands at Rs 5,053.97 crore. That places it in the Mid Cap category and above the same-industry median market capitalisation of Rs 472.86 crore. The company operates in the Chemicals sector.
