
VTM (VTMLTD) Share Price Falls 8.5% as Stock Hits Day’s Low
- September 28, 2026
- Posted by: Harsh Piplani
- Category: News
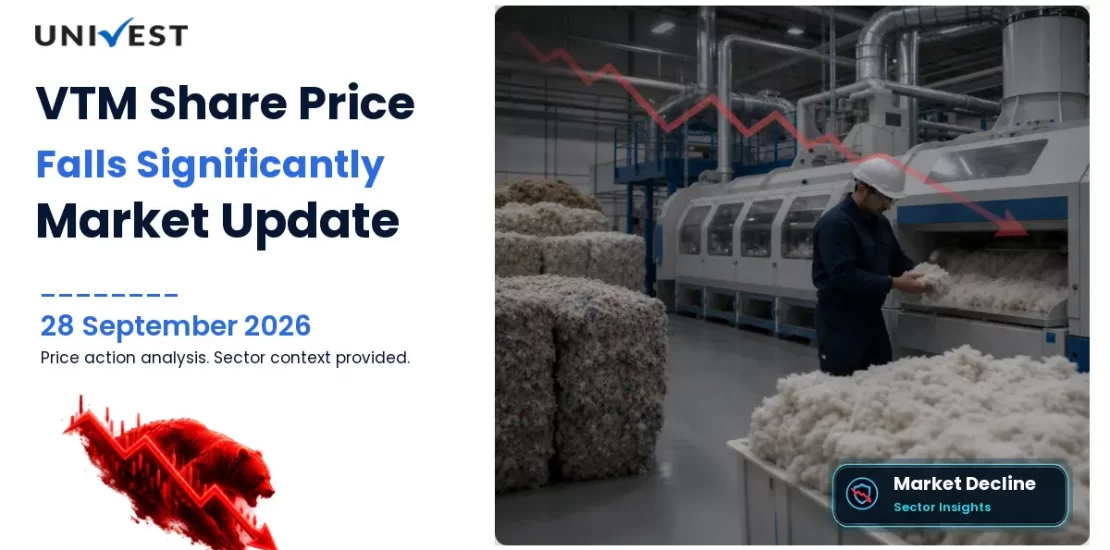
VTM Share Price moved lower through the session and ended at Rs 38, a decline of 8.5% from the previous close of Rs 41.53. The stock opened at Rs 41.98 and touched an intraday high of Rs 43.05 before falling to the day’s low and closing point. The move left VTM with a market capitalisation of Rs 417.66 crore and kept the stock in the Micro Cap category. This VTM Stock News update stays with verified price action and related fundamentals; the supplied data does not establish a company-specific trigger for the fall.
For readers tracking VTM Share Price Today, the main takeaway is direct: the stock finished at the low of the day, below both the opening level and the earlier high. That makes this a clear same-day price fall rather than a broader trend call. Univest presents the event as a factual market move and then places it beside valuation, sector context and peer comparison so the numbers can be read in a structured way.
VTM (VTMLTD) Share Price Today: Price Action Analysis
| Metric | Value |
|---|---|
| Current Price | Rs 38 |
| Previous Close | Rs 41.53 |
| Today's Move | -Rs 3.53 (-8.5%) |
| Open | Rs 41.98 |
| High | Rs 43.05 |
| Low | Rs 38 |
| Turnover | Rs 0.14 crore |
| Market Capitalisation | Rs 417.66 crore |
| Market Cap Category | Micro Cap |
VTM Share Price showed a clean intraday decline: the stock started above the previous close, briefly traded higher, and then slipped to Rs 38. The final print matched the day’s low, which confirms that the session ended on a weak note. The day change of Rs -3.53 equals an 8.5% fall, making today’s move the key event for traders scanning VTM Stock Falling Today screens.
Turnover was Rs 0.14 crore, which is a data point rather than a cause. With no verified company-specific catalyst in the supplied information, the correct reading is simple: VTM Share Price declined on the day, but the record does not say why. For market watchers, that means the price action itself is the main fact to follow, alongside the company’s valuation and sector position.
The move is also notable because it happened after an open of Rs 41.98 and an intraday high of Rs 43.05. That sequence leaves VTM Share Price Today below the opening level and below the earlier session peak. Univest keeps the discussion focused on what the market data confirms, not on unverified reasons.
VTM (VTMLTD) Fundamental Analysis
| Metric | Value |
|---|---|
| Market Capitalisation | Rs 417.66 crore |
| P/E Ratio | 48.99x |
| P/B Ratio | 1.32x |
| ROE | 3.6% |
| ROCE | 4.55% |
| EPS | Rs 0.85 |
| Book Value Per Share | Rs 31.51 |
| Dividend Yield | 0% |
VTM Fundamental Analysis shows a mixed profile. The company’s P/E ratio is 48.99 and its P/B ratio is 1.32. EPS stands at Rs 0.85, book value at Rs 31.51 per share, and dividend yield at 0. These figures matter because they show how VTM Share Price is being judged against earnings, net worth and cash distribution, not just against the day’s move.
Return ratios remain modest. ROE is 3.6% and ROCE is 4.55%, which are both important in any VTM Stock Analysis. The current VTM Share Price is therefore sitting against a background of return generation, even as the book value is not far below the market price. That combination places the stock in a valuation-and-quality discussion rather than a simple price-momentum story.
In practical terms, the current price is closer to book value than some expensive growth names, but the earnings multiple is still elevated relative to the peer median discussed below. That is why VTM Share Price News needs to be read with both the day’s fall and the company’s financial ratios in view.
Sector and Industry Context
| Metric | Value |
|---|---|
| Sector | Textile |
| Industry | Textile – Weaving |
| Benchmark Scope | same industry |
| Company P/E Ratio | 48.99x |
| Benchmark Median P/E | 20.4x |
| Benchmark Average P/E | 32.5x |
| Benchmark P/E Range | 3.2x to 113.04x |
| Company P/B Ratio | 1.32x |
| Benchmark Median P/B | 1.71x |
| Benchmark Average P/B | -113.59x |
| Company ROE | 3.6% |
| Benchmark Median ROE | 3.6% |
| Benchmark Average ROE | -107.02% |
| Company ROCE | 4.55% |
| Benchmark Median ROCE | 9.06% |
| Benchmark Average ROCE | -9.56% |
| Company Market Capitalisation | Rs 417.66 crore |
| Benchmark Median Market Cap | Rs 112.93 crore |
| Benchmark Average Market Cap | Rs 334.83 crore |
VTM operates in the Textile sector and the Textile – Weaving industry. The supplied benchmark set includes 17 companies in the same industry, which gives a useful frame for reading VTM Share Price. Its P/E ratio of 48.99 is above the industry median of 20.4 and above the average of 32.5. Its P/B ratio of 1.32 is below the industry median of 1.71. ROE at 3.6 matches the industry median, while ROCE at 4.55 is below the median of 9.06.
Market capitalisation is another useful comparison point. VTM stands at Rs 417.66 crore, above the industry median market cap of Rs 112.93 crore and above the supplied average of Rs 334.83 crore. So while VTM Share Price Today declined on the session, the company still sits above the typical size of many direct weaving peers by market value. That is why the day’s fall should be read alongside its sector position, not in isolation.
Peer Comparison
| Company | Symbol | Market Cap (Cr) | P/E | P/B | ROE (%) | ROCE (%) |
|---|---|---|---|---|---|---|
| Siyaram Silk Mills | SIYSIL | 2,436.37 | 10.27 | 1.66 | 16.83 | 20.46 |
| United Polyfab Gujarat | UNITEDPOLY | 1,070.69 | 39.2 | 7.62 | 19.99 | 15.11 |
| Manomay Tex India | MANOMAY | 410.88 | 20.4 | 2.34 | 13.89 | 12.74 |
| Aarvee Denims & Exports | VGL | 342.67 | 0 | 4.86 | 22.08 | 18.9 |
| Ludlow Jute & Specialities | LUDLOWJUT | 342.53 | 18.92 | 1.78 | 9.13 | 10.31 |
Peer data shows a mixed group. Siyaram Silk Mills has a much lower P/E and stronger return ratios. United Polyfab Gujarat carries a higher valuation and stronger ROE, while Manomay Tex India sits closer to the benchmark median on several measures. Aarvee Denims & Exports and Ludlow Jute & Specialities add further spread across valuation and returns. In that setting, VTM Share Price is not uniquely cheap or expensive on every metric, but it does sit on the richer side of earnings valuation while its return ratios remain modest.
That comparison is useful because it keeps VTM Stock Analysis grounded in nearby listed names rather than broad assumptions. The company’s market cap is above several peers, yet its ROCE is below the industry median. Readers following VTM Share Price News can therefore see how today’s decline fits into a wider valuation and profitability picture.
Why Investors Are Watching VTM
- VTM Share Price fell 8.5% today, moving from Rs 41.53 to Rs 38.
- The stock opened at Rs 41.98, touched Rs 43.05 and closed at Rs 38, which defines the full session range.
- Market capitalisation stands at Rs 417.66 crore, placing VTM in the Micro Cap category.
- Key fundamentals include P/E of 48.99, P/B of 1.32, ROE of 3.6, ROCE of 4.55, EPS of Rs 0.85 and book value of Rs 31.51.
- In the Textile – Weaving peer set, VTM trades above the industry median P/E of 20.4 and below the ROCE median of 9.06.
About VTM
VTM is classified in the Textile sector and the Textile – Weaving industry. The supplied company context places it in the same benchmark set used throughout this article, so VTM Share Price can be compared with other listed weaving names on valuation, returns and market value. The summary here is intentionally factual and stays within the data provided.
That approach helps keep VTM Stock News focused on verified details only. Readers can compare VTM Share Price with its peers and sector benchmarks without adding assumptions about operating drivers or business specifics that are not included in the dataset.
Track VTM Share Price on Univest
Use VTM (VTMLTD) live share-price page,Univest top decliners screener,Univest market blogsto review live stock data, top decliners and related market analysis.
Readers can track VTM Share Price on Univest for live price updates, company fundamentals, market capitalisation, valuation ratios and sector comparisons. Univest also brings together stock news and market data so that VTM Stock News can be followed in one place.
For users monitoring VTM Share Price Live, Univest offers a simple way to revisit the latest figures and see how the stock stands versus textile peers and the day’s market move.
Disclaimer: Data and figures in this article are sourced from publicly available information. These may or may not be accurate. Please verify all data with the official NSE (nseindia.com) and BSE (bseindia.com) websites before making any investment decision. Investments in securities are subject to market risk. This content is for educational purposes only and is not investment advice by Univest (SEBI RA INH000013776).
Frequently Asked Questions
Why is VTM falling today?
Ans. VTM Share Price fell 8.5% today to Rs 38 from the previous close of Rs 41.53. The supplied data confirms the price move, but it does not establish a company-specific catalyst for the decline.
What is VTM Share Price today?
Ans. VTM Share Price Today is Rs 38. The stock moved between Rs 41.98 and Rs 43.05 during the session before ending at the day’s low of Rs 38. The previous close was Rs 41.53.
How much did VTM share price fall today?
Ans. VTM Share Price fell by Rs 3.53, which equals 8.5%. That decline took the stock below its previous close and made today’s move the key event in the session. The previous close was Rs 41.53.
What is the market capitalisation of VTM?
Ans. VTM has a market capitalisation of Rs 417.66 crore. The company is classified as a Micro Cap, which is factual size context rather than a view on future performance. The company operates in the Textile sector.
How does VTM compare with Textile peers on valuation?
Ans. VTM has a P/E ratio of 48.99, above the industry median of 20.4 and above the average of 32.5 for the 17-company Textile – Weaving benchmark set. Its P/B is 1.32.
What do VTM ROE and ROCE show?
Ans. VTM reports ROE of 3.6 and ROCE of 4.55. In the same industry benchmark, ROE matches the median of 3.6, while ROCE sits below the median of 9.06. ROE stands at 3.6%.
What is the EPS and book value of VTM?
Ans. VTM reports EPS of Rs 0.85 and book value of Rs 31.51 per share. EPS shows earnings per share, while book value shows the accounting net worth behind each share.
Does VTM pay a dividend?
Ans. The supplied dividend yield is 0. That means no dividend yield is shown in the current data set, so the stock’s current appeal rests more on price action and financial ratios.
