
BRANDMAN RETAIL (BRANDMAN-SM) Share Price Falls 8.41% Today
- September 15, 2026
- Posted by: Harsh Piplani
- Category: News
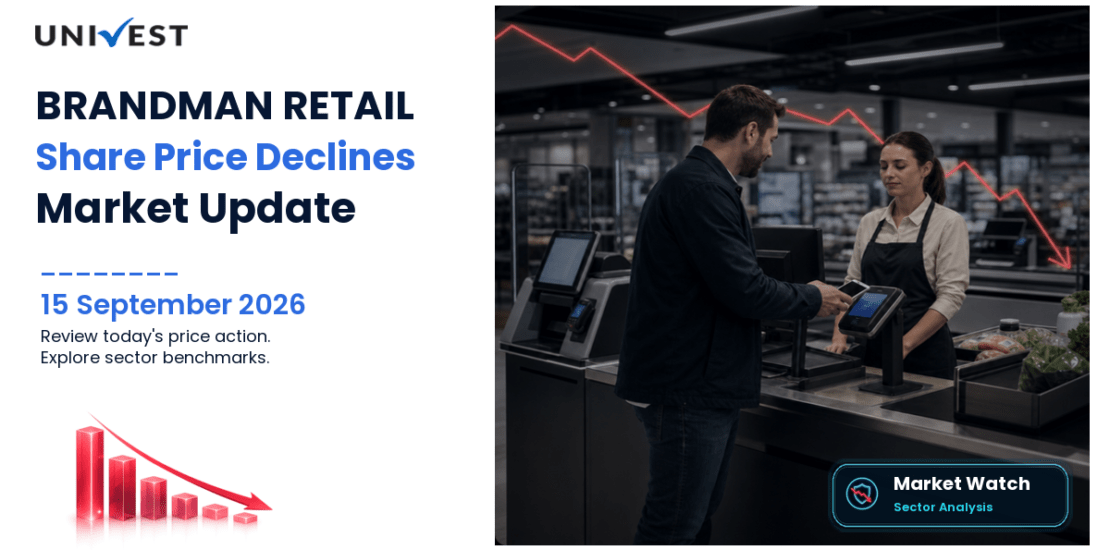
BRANDMAN RETAIL Share Price fell to Rs 158 on 15 September 2026, down 8.41% for the day. The company’s market capitalisation stood at Rs 318.39 crore at the time of the update. The stock opened at Rs 166.2, touched a high of Rs 167.2, and slipped to an intraday low of Rs 158, which was also the prevailing market price.
This move stands out because the stock traded below its previous close of Rs 172.5 throughout the session data supplied here. While the decline is clear, the available dataset does not specify any company-specific trigger. That means the most reliable way to assess the situation is through confirmed price action, trading levels, valuation ratios, profitability measures and sector comparisons rather than speculation about a cause.
For readers following BRANDMAN RETAIL Share Price today, the immediate picture is simple: the stock is down sharply in a single session, turnover is Rs 0.47 crore, and the company remains classified as a Micro Cap within the Retailing industry. Those facts alone can draw attention, especially when paired with financial ratios that differ meaningfully from broader industry benchmarks.
BRANDMAN RETAIL (BRANDMAN-SM) Share Price Today: Price Action Analysis
| Metric | Value |
|---|---|
| Current Price | Rs 158 |
| Previous Close | Rs 172.5 |
| Today's Move | -Rs 14.50 (-8.41%) |
| Open | Rs 166.2 |
| High | Rs 167.2 |
| Low | Rs 158 |
| Turnover | Rs 0.47 crore |
| Market Capitalisation | Rs 318.39 crore |
| Market Cap Category | Micro Cap |
The trading pattern shows persistent weakness through the session. From a previous close of Rs 172.5, the stock opened lower at Rs 166.2 and only reached Rs 167.2 at its intraday high. It then moved down to Rs 158. Because the current price matched the day’s low, the stock was trading at the weakest point of the session when this snapshot was recorded.
That detail matters. When a stock remains below the previous close for the whole observed range and finishes near the session low, it usually signals sustained selling pressure within that day’s trading data. Turnover of Rs 0.47 crore also provides context: for a Micro Cap name, even modest trading value can coincide with visible price swings.
In short, the available figures confirm a sharp same-session decline, but they do not prove why it happened. Investors looking at BRANDMAN RETAIL Share Price Update therefore need to separate the verified move from any unverified narrative around it.
BRANDMAN RETAIL (BRANDMAN-SM) Fundamental Analysis
| Metric | Value |
|---|---|
| Market Capitalisation | Rs 318.39 crore |
| P/E Ratio | 12.59x |
| P/B Ratio | 2.17x |
| ROE | 108.47% |
| ROCE | 115.79% |
| EPS | Rs 13.7 |
| Book Value Per Share | Rs 79.47 |
| Dividend Yield | 0% |
On fundamentals, the stock presents a notable mix of moderate valuation and very high profitability ratios based on the supplied numbers. The company trades at a P/E of 12.59 and a P/B of 2.17. EPS is Rs 13.7 and book value per share is Rs 79.47, which together help frame how the current market price relates to earnings and net worth.
The most striking figures are the return ratios. ROE stands at 108.47% and ROCE at 115.79%. On their face, those are unusually elevated readings for a retailing company and are far above the broad sector medians shown in the benchmark dataset. Dividend yield is listed at 0, so the stock is not showing a current historical cash yield in the available figures.
Because the company is a Micro Cap with a market capitalisation of Rs 318.39 crore, these ratios should be read as descriptive rather than predictive. They explain why the stock can remain on the radar even during a weak trading session: the valuation looks lower than many sector peers, while the supplied return metrics stand out sharply.
Sector and Industry Context
| Metric | Value |
|---|---|
| Sector | Retailing |
| Industry | Retailing |
| Benchmark Scope | same industry |
| Company P/E Ratio | 12.59x |
| Benchmark Median P/E | 23.78x |
| Benchmark Average P/E | 67.95x |
| Benchmark P/E Range | 0.99x to 1,393.77x |
| Company P/B Ratio | 2.17x |
| Benchmark Median P/B | 2.16x |
| Benchmark Average P/B | 3.32x |
| Company ROE | 108.47% |
| Benchmark Median ROE | 11.93% |
| Benchmark Average ROE | 13.29% |
| Company ROCE | 115.79% |
| Benchmark Median ROCE | 18.03% |
| Benchmark Average ROCE | 15.75% |
| Company Market Capitalisation | Rs 318.39 crore |
| Benchmark Median Market Cap | Rs 188.68 crore |
| Benchmark Average Market Cap | Rs 8,047.07 crore |
BRANDMAN RETAIL operates in the Retailing sector and industry, with benchmark data covering 71 companies from the same industry. Against that set, the company’s P/E of 12.59 is below the median P/E of 23.78 and well below the average of 67.95 across 56 companies with available P/E data.
Its P/B ratio of 2.17 is close to the benchmark median of 2.16 and below the benchmark average of 3.32 across 69 companies. That suggests the stock is not especially far from the industry midpoint on book value, even though it screens cheaper on earnings.
The return ratios create the largest contrast. ROE of 108.47% is far above the industry median of 11.93% and average of 13.29%, while ROCE of 115.79% is far above the median of 18.03% and average of 15.75%. On company size, the market capitalisation of Rs 318.39 crore is above the industry median of Rs 188.68 crore but far below the average of Rs 8,047.07 crore, which reflects the presence of much larger listed retailers.
Peer Comparison
| Company | Symbol | Market Cap (Cr) | P/E | P/B | ROE (%) | ROCE (%) |
|---|---|---|---|---|---|---|
| Avenue Supermarts | DMART | 2,40,541.79 | 78.66 | 9.53 | 12.99 | 18.03 |
| Trent | TRENT | 1,49,544.98 | 82.67 | 19.86 | 27.66 | 36.73 |
| VISHAL MEGA MART | VMM | 47,550.81 | 53.31 | 6.24 | 12.29 | 19.24 |
| Metro Brands | METROBRAND | 25,622.76 | 63.04 | 12.45 | 22.8 | 35.77 |
| ADITYA BIRLA LIFES BRAN L | ABLBL | 10,182.81 | 57.86 | 7.27 | 24.67 | 27.34 |
The peer table highlights how small the company is compared with major retailing names. BRANDMAN RETAIL’s market cap of Rs 318.39 crore is far below Avenue Supermarts, Trent, VISHAL MEGA MART, Metro Brands and ADITYA BIRLA LIFES BRAN L.
On valuation, the company’s P/E of 12.59 is lower than all five peers listed, whose earnings multiples range from 53.31 to 82.67. Its P/B of 2.17 is also below the comparable peer group shown here, where P/B ranges from 6.24 to 19.86.
Returns are where the contrast becomes most unusual. The supplied ROE of 108.47% and ROCE of 115.79% are above all the peer figures in this dataset. That does not make the companies directly comparable on size or business profile, but it does show why the stock can screen differently from larger, more established retailing names.
Why Investors Are Watching the Stock
- The stock fell 8.41% in a single session from Rs 172.5 to Rs 158.
- The current price matched the day’s low, indicating weak intraday positioning.
- Turnover stood at Rs 0.47 crore, with the company classified as a Micro Cap.
- P/E of 12.59 is below the same-industry median of 23.78.
- ROE of 108.47% and ROCE of 115.79% stand far above industry medians.
About BRANDMAN RETAIL
The company is classified in the Retailing sector and Retailing industry. The broader benchmark data shows that this space contains companies with very different sizes and valuation profiles, from very small firms to some of the largest listed retail businesses in India.
That wide spread is visible in the benchmark itself: market capitalisations range from Rs 1.44 crore to Rs 2,40,541.79 crore, and P/E ratios range from 0.99 to 1,393.77. Within that context, BRANDMAN RETAIL sits as a Micro Cap stock with metrics that are modest on valuation and unusually high on the supplied return ratios.
Track BRANDMAN RETAIL on Univest
Use Univest top decliners screener, and Univest market blogs to review live stock data, top decliners and related market analysis.
For investors tracking BRANDMAN RETAIL Share Price over time, these tools can help monitor live price changes, market-cap shifts, valuation ratios, peer comparisons and fresh company disclosures when available. That is especially useful on days when the price move is clear but the dataset does not confirm a specific reason behind it.
Disclaimer: Data and figures in this article are sourced from publicly available information. These may or may not be accurate. Please verify all data with the official NSE (nseindia.com) and BSE (bseindia.com) websites before making any investment decision. Investments in securities are subject to market risk. This content is for educational purposes only and is not investment advice by Univest (SEBI RA INH000013776).
Frequently Asked Questions
Why did BRANDMAN RETAIL Share Price fall today?
Ans. The stock fell 8.41% to Rs 158 from the previous close of Rs 172.5. The supplied data confirms the decline, but it does not identify any company-specific catalyst. The intraday range extended from Rs 158 to Rs 167.2.
What does today’s price action indicate?
Ans. The session data indicates weakness because the stock opened below the previous close, failed to hold its early high, and was trading at the day’s low at the time of the snapshot.
What is the market capitalisation of the company?
Ans. The market capitalisation is Rs 318.39 crore, placing the company in the Micro Cap category. The company operates in the Retailing sector. Its P/E ratio is 12.59x. ROE is 108.47% and ROCE is 115.79%.
Is the stock expensive on P/E and P/B?
Ans. Based on supplied figures, the stock trades at a P/E of 12.59 and a P/B of 2.17. Its P/E is below the same-industry median of 23.78, while its P/B is close to the median of 2.16.
How does it compare with sector peers?
Ans. The company is much smaller by market cap than peers such as Avenue Supermarts, Trent and Metro Brands. However, its P/E is lower than the listed peers in this dataset, while its supplied ROE and ROCE are higher.
Track BRANDMAN RETAIL (BRANDMAN-SM) Share Price on Univest
UseBRANDMAN RETAIL (BRANDMAN-SM) live share-price page,Univest top decliners screener,Univest market blogsto review live stock data, top decliners and related market analysis.
