
Rectangle Chart Pattern Explained: Range Support and Resistance, Breakout Rules, Price Target and How to Avoid False Breakouts
- November 18, 2026
- Posted by: Kunal Singla
- Category: Market
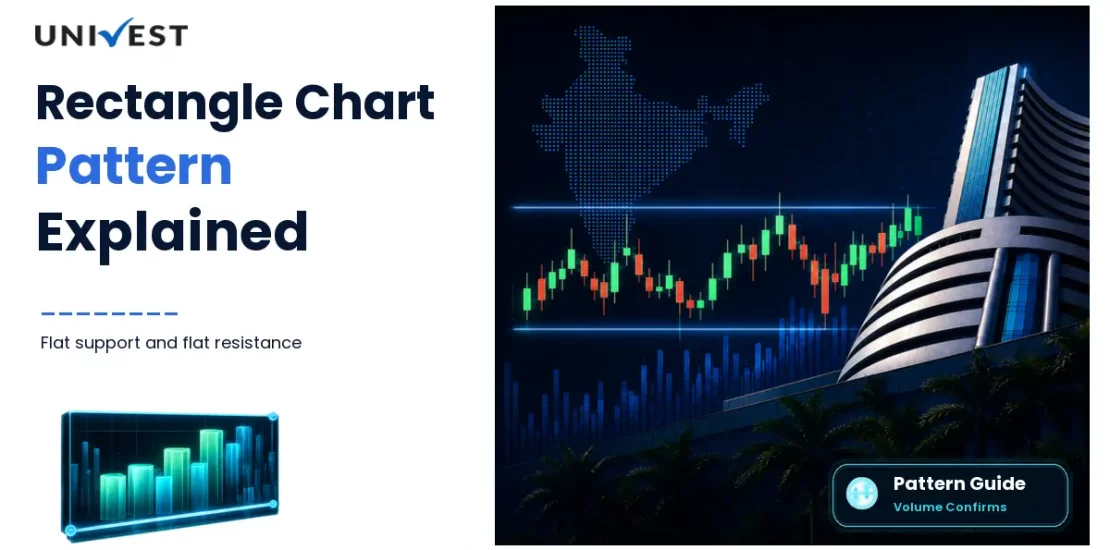
Rectangle: price moves between flat support and resistance with at least two touches each. Usually a continuation pattern. Target = rectangle height from the breakout. Confirm with volume.
Quick Answer
Rectangle chart pattern explained simply: it forms when price moves sideways between a flat support level and a flat resistance level, with at least two touches on each. It is usually a continuation pattern, so price tends to break out in the direction of the earlier trend. The price target is the height of the rectangle projected from the breakout, and volume helps confirm that the break is real.
Rectangle chart pattern explained for traders who see price stuck in a box: the pattern shows a tug of war between buyers and sellers, and the exit from the box usually gives the next move.
This guide covers how to identify it, trading rules, the target and stop loss and how to avoid false breakouts. It is educational and not a recommendation.
Click Here – Get Free Investment Predictions
Rectangle Chart Pattern Explained: What It Looks Like
A rectangle forms when price bounces between two horizontal lines, a support level below and a resistance level above. Each line needs at least two touches. Price moves sideways during a period of consolidation, and volume often fades as the box matures.
Bullish and Bearish Rectangles
| Type | Earlier trend | Usual breakout |
|---|---|---|
| Bullish rectangle | Uptrend | Upward through resistance |
| Bearish rectangle | Downtrend | Downward through support |
Rectangles are mostly continuation patterns, but they can also end a trend, so wait for the breakout rather than guessing the direction.
How to Trade the Breakout
- Draw the two horizontal lines through at least two highs and two lows.
- Wait for a candle close above resistance, or below support, ideally with volume well above average.
- Enter on the close or on a retest of the broken level.
- Place the stop loss just inside the rectangle, such as below the broken resistance for a long trade.
- Set the price target at the rectangle height added to the breakout point.
| Item | Example |
|---|---|
| Support | Rs 200 |
| Resistance | Rs 220 |
| Pattern height | Rs 20 |
| Breakout above | Rs 220 |
| Price target | Rs 240 |
Trading Inside the Rectangle
Use the Univest Screener to check live fundamentals before you act on any idea.
Some traders buy near support and sell near resistance while the box holds, with a tight stop loss just outside. This works only while the trading range stays intact, and the loss is quick when it breaks, so most beginners are better off waiting for the breakout.
Avoiding False Breakouts
- Wait for a close beyond the line, not just a wick.
- Check that volume expands on the breakout.
- Look for a retest that holds the broken level.
- Prefer rectangles that took several weeks to form.
- Check the trend on a higher timeframe, such as the daily chart of an index like the Nifty 50.
Common Mistakes
- Drawing lines through only one touch.
- Ignoring the earlier trend direction.
- Entering early and getting caught by a false break.
- Setting a target without checking nearby resistance.
- Skipping a stop loss.
A rectangle chart pattern is easiest to spot on a daily chart when the price range has held for several weeks. The longer the trading range lasts, the more orders build up at each edge, and the more energy the eventual move carries. A rectangle pattern that lasts only a few days is usually noise.
Keep notes on each rectangle pattern you trade: the width of the trading range, the number of touches and how the move ended. Over twenty or thirty examples you learn how this rectangle chart pattern behaves on the stocks and indices you follow, which is more useful than any general rule.
Download the Univest iOS App or Univest Android App to get daily stock research and market updates.
Conclusion
A rectangle forms between flat support and resistance, and the breakout usually follows the earlier trend. The target is the height of the box projected from the break.
Use volume, a close beyond the line and a stop loss to protect against false breakouts.
Disclaimer: Data and figures in this article are sourced from publicly available information. These may or may not be accurate. Please verify all data with the official NSE (nseindia.com) and BSE (bseindia.com) websites before making any investment decision. Investments in securities are subject to market risk. This content is for educational purposes only and is not investment advice by Univest (SEBI RA INH000013776).
Frequently Asked Questions
What is a rectangle chart pattern?
Ans. It is a pattern where price moves sideways between a flat support level and a flat resistance level, forming a box on the chart.
Is a rectangle pattern bullish or bearish?
Ans. It depends on the breakout. After an uptrend it tends to break up, and after a downtrend it tends to break down, but the break confirms the direction.
How do you calculate the target for a rectangle?
Ans. Measure the height between support and resistance and add it to the breakout level for a bullish break, or subtract it for a bearish break.
How many touches are needed for a valid rectangle?
Ans. At least two touches on resistance and two on support are needed to form the pattern.
Where should the stop loss go?
Ans. Just inside the rectangle, such as below the broken resistance after an upside breakout.
How is a rectangle different from a triangle?
Ans. A rectangle has flat lines at both sides, while a triangle has converging lines, so volatility narrows in a triangle but stays steady in a rectangle.
Can a rectangle give a false breakout?
Ans. Yes. Many breaks fail and fall back into the range, so wait for a close and volume confirmation.
