
India VIX 5-Month Low: Could This Unusual Calm Attract Smart Money Back to Indian Markets?
- July 7, 2026
- Posted by: Ankit Jaiswal
- Category: News
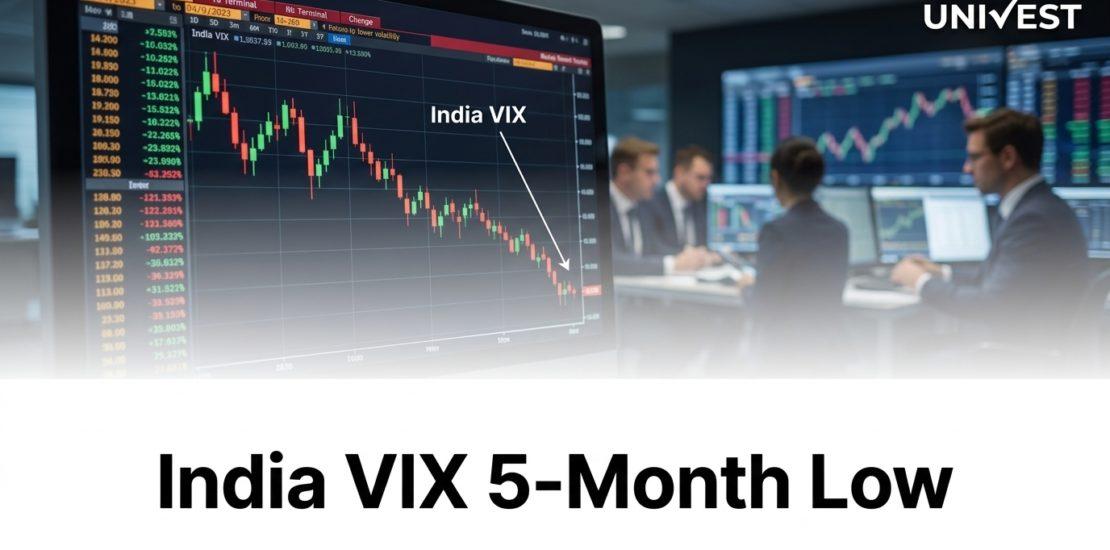
India VIX 5-month low near 11.65 on 7 July 2026, well below its 52-week average and typical 15-35 range. Historically, low VIX readings signal market stability and can precede institutional buying.
This India VIX 5-month low has caught the market’s attention, with the index trading around 11.65 on 7 July 2026, down 1.44 percent for the session and sitting well below its typical 15 to 35 range. Often referred to as the market’s fear gauge, India VIX measures the market’s expectation of Nifty volatility over the next 30 days based on options pricing, and a reading this low signals unusually calm expectations at a time when several individual stocks, including Trent and Kalyan Jewellers, have swung sharply on their own specific news.
The India VIX 5-month low comes even as the market has absorbed a genuinely eventful week: Q1 FY27 business updates triggering double-digit single-stock moves, a government OFS in Cochin Shipyard, and a split brokerage verdict on names like Trent. That the broader volatility gauge remains this subdued despite active stock-specific turbulence is itself a notable divergence.
Click Here – Get Free Investment Predictions
India VIX 5-Month Low: Key Data
| Metric | Value |
|---|---|
| Current India VIX Level | ~11.65 |
| Change Today | -1.44% |
| Typical Historical Range | 15-35 |
| 52-Week Range (approx.) | 8.72 – 28.91 |
| Historical Interpretation Below 20 | Denotes low volatility and market stability |
| All-Time High (Nov 2008, GFC) | 92.5 |
| COVID-Era High (March 2020) | 87 |
What Historically Happens When India VIX Hits Multi-Month Lows
A falling India VIX reflects growing investor confidence and reduced hedging demand, as option premiums compress when market participants expect smaller price swings ahead. Historically, periods of sustained low VIX readings have coincided with steady institutional accumulation, since lower expected volatility reduces the cost of building large positions and makes risk management more predictable for large funds. This India VIX 5-month low arrives alongside supportive institutional flow data, with domestic institutional investors having bought shares worth Rs 3,791 crore and foreign institutional investors also turning net buyers earlier this week.
Get Research-Backed Stock Ideas from a SEBI Registered Investment Advisor
Could This India VIX 5-Month Low Attract Smart Money?
The theoretical case for smart money being drawn to periods of market stability rests on lower transaction and hedging costs, more predictable options pricing for large block trades, and reduced tail-risk premiums that institutional mandates often price into position sizing decisions. A sustained India VIX 5-month low, if it holds, could make Indian equities relatively more attractive to large institutional allocators who had been sitting on the sidelines during more volatile stretches earlier in the year.
That said, India VIX is explicitly a non-directional measure. A low reading signals calm expectations, not a guaranteed market direction, and low-volatility regimes can persist for extended periods without triggering a fresh wave of buying if other macro factors, such as global rate uncertainty, keep large allocators cautious regardless of India-specific calm.
What Should Investors Watch Next
Investors tracking this India VIX 5-month low should watch whether the reading holds through the upcoming Q1 FY27 earnings season, historically a period of elevated event risk that can push VIX higher regardless of the broader trend, along with incoming FII and DII flow data to see whether institutional buying actually follows this stability signal.
Download the Univest iOS App or Univest Android App to track India VIX and market volatility live with daily research.
Conclusion
The India VIX 5-month low near 11.65 signals unusually calm volatility expectations even as individual stocks have swung sharply this week on company-specific news. Historically, such stability phases have coincided with steady institutional buying, and this reading arrives alongside supportive FII and DII flow data. Whether this translates into a fresh wave of smart money allocation will depend on whether the calm holds through the more event-heavy earnings season ahead.
Disclaimer: Data and figures in this article are sourced from publicly available information. These may or may not be accurate. Please verify all data with the official NSE (nseindia.com) and BSE (bseindia.com) websites before making any investment decision. Investments in securities are subject to market risk. This content is for educational purposes only and is not investment advice by Univest (SEBI RA INH000013776).
Frequently Asked Questions on the India VIX 5-Month Low
What is the India VIX 5-month low level?
Ans. India VIX is trading around 11.65 on 7 July 2026, its lowest level in roughly five months, well below its typical historical range of 15 to 35.
What does a low India VIX reading mean?
Ans. A low India VIX reading signals that options markets expect reduced Nifty volatility over the next 30 days, generally denoting market stability and investor confidence, as opposed to high readings that signal fear and uncertainty.
Could this India VIX 5-month low attract institutional smart money?
Ans. Historically, periods of sustained low volatility have coincided with steady institutional accumulation, since lower expected volatility reduces hedging costs and makes large position building more predictable, though VIX itself does not guarantee any specific market direction.
Is India VIX a directional indicator for the stock market?
Ans. No, India VIX is explicitly non-directional. It measures the market’s expectation of volatility, not whether prices will rise or fall, making it a risk gauge rather than a price prediction tool.
What is India VIX’s all-time high?
Ans. India VIX’s highest ever reading was 92.5, recorded in November 2008 during the Global Financial Crisis, followed by a reading of 87 in March 2020 during the COVID-19 pandemic.
Why is this India VIX 5-month low notable given recent stock volatility?
Ans. This low VIX reading is notable because it comes even as individual stocks like Trent and Kalyan Jewellers have swung sharply on company-specific news this week, showing that broad market volatility expectations remain calm despite active single-stock turbulence.
Should investors change their strategy based on this India VIX 5-month low?
Ans. This article does not constitute investment advice. Low VIX readings reflect calm expectations, not guaranteed outcomes. Evaluate broader portfolio strategy and consult a SEBI registered financial advisor before making decisions.
