
MOIL Q1 Production Rises 1.2 Percent as Sales Grow 3.4 Percent Year on Year, Stock Trades Well Below 52-Week High
- July 7, 2026
- Posted by: Kunal Singla
- Category: News
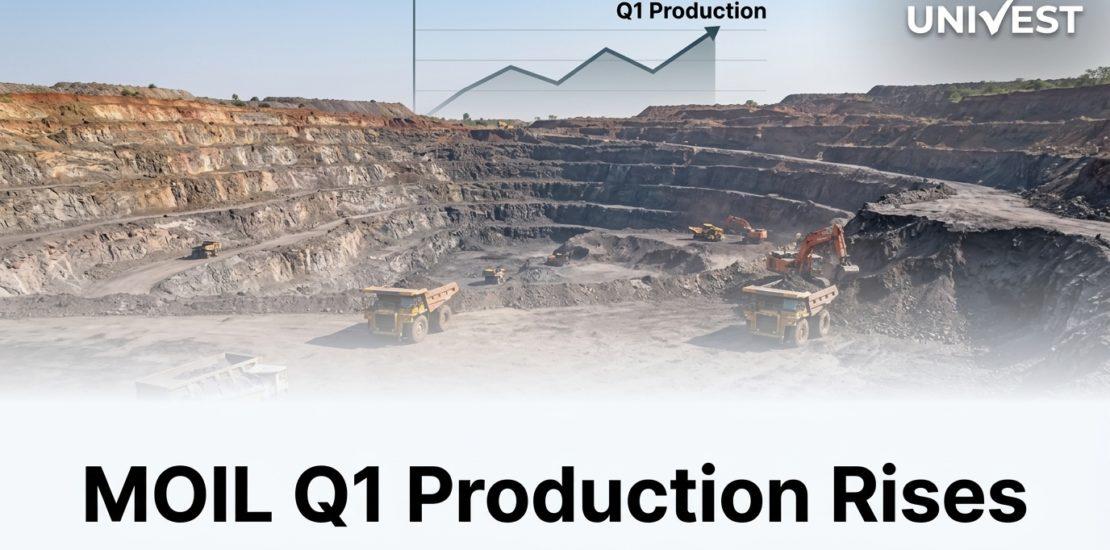
MOIL Q1 production up 1.2% YoY, sales up 3.4% YoY. Stock at Rs 276.80, down 1.04%. Trading 31.26% below 52-week high of Rs 405.10 and 14.75% above 52-week low of Rs 242.65.
The MOIL Q1 production update for FY27 showed output rising 1.2 percent year on year, while sales volumes grew a stronger 3.4 percent over the same period. MOIL was quoting at Rs 276.80 on the NSE, down 1.04 percent, after touching an intraday high of Rs 280.90 and a low of Rs 276.80.
Despite the modest production growth, the stock remains well off its highs, trading 31.26 percent below its 52-week high of Rs 405.10 touched in October 2025, while sitting 14.75 percent above its 52-week low of Rs 242.65 recorded in March 2026.
Click Here – Get Free Investment Predictions
MOIL Q1 Production and Stock Data
| Metric | Value |
|---|---|
| Q1 Production Growth | +1.2% YoY |
| Q1 Sales Growth | +3.4% YoY |
| CMP (7 July, 10:51 AM) | Rs 276.80 |
| Change | -1.04% |
| Previous Session Close | Rs 279.60 (-0.87%) |
| 52-Week High | Rs 405.10 (6 Oct 2025) |
| 52-Week Low | Rs 242.65 (17 Mar 2026) |
| Distance from 52W High | -31.26% |
| Distance from 52W Low | +14.75% |
| Market Capitalisation | Rs 5,666.05 crore |
What the MOIL Q1 Production Numbers Tell Us
MOIL is India’s largest manganese ore producer, and the gap between the 1.2 percent production growth and the stronger 3.4 percent sales growth suggests the company is drawing down inventory alongside fresh output, or benefiting from improved realisations that lift the value of sales relative to volume produced. Either way, sales outpacing production is typically a healthy signal, indicating demand is not the bottleneck.
Manganese ore is a critical input for steel manufacturing, so MOIL’s production trends are closely tied to the health of India’s steel sector, which has itself seen mixed performance recently amid a broader correction in metal stocks.
Get Research-Backed Stock Ideas from a SEBI Registered Investment Advisor
Why MOIL Stock Trades Well Below Its 52-Week High
MOIL shares are down over 31 percent from their 52-week high, reflecting broader weakness in metal and mining stocks amid corrections in global commodity prices and profit booking after a strong prior rally. The relatively modest 1.2 percent production growth this quarter, against a backdrop of high market expectations set during the stock’s earlier rally, may also be contributing to muted investor enthusiasm despite the healthier sales growth figure.
What Should Investors Watch Next
Investors tracking MOIL should watch manganese ore price realisations, steel sector demand trends that drive downstream consumption, and the company’s detailed quarterly financial results for margin and profitability data beyond the operational production and sales figures already disclosed.
Download the Univest iOS App or Univest Android App to track MOIL live and get daily research on mining and metal stocks.
Conclusion
MOIL Q1 production for FY27 grew 1.2 percent year on year with sales rising a stronger 3.4 percent, though the stock remains 31.26 percent below its 52-week high, trading at Rs 276.80 on 7 July 2026. Manganese ore realisations and downstream steel demand will be the key drivers to watch as the company’s detailed quarterly results follow.
Disclaimer: Data and figures in this article are sourced from publicly available information. These may or may not be accurate. Please verify all data with the official NSE (nseindia.com) and BSE (bseindia.com) websites before making any investment decision. Investments in securities are subject to market risk. This content is for educational purposes only and is not investment advice by Univest (SEBI RA INH000013776).
Frequently Asked Questions on MOIL Q1 Production
What did the MOIL Q1 production update show?
Ans. The MOIL Q1 production update for FY27 showed output growth of 1.2 percent year on year, while sales volumes grew a stronger 3.4 percent over the same period.
Why is MOIL Q1 production growth lower than sales growth?
Ans. The gap suggests the company may be drawing down inventory alongside fresh output or benefiting from improved realisations, both of which are generally healthy signals that demand is not the constraint on the business.
What is the MOIL share price today?
Ans. MOIL was quoting at Rs 276.80 on the NSE on 7 July 2026, down 1.04 percent, after touching an intraday high of Rs 280.90.
How far is MOIL trading from its 52-week high?
Ans. MOIL is trading 31.26 percent below its 52-week high of Rs 405.10, which the stock touched on 6 October 2025, and 14.75 percent above its 52-week low of Rs 242.65 recorded on 17 March 2026.
What does MOIL do?
Ans. MOIL Limited is India’s largest producer of manganese ore, a critical raw material used in steel manufacturing, with mining operations concentrated in Madhya Pradesh and Maharashtra.
What is MOIL’s market capitalisation?
Ans. MOIL’s market capitalisation stands at Rs 5,666.05 crore as of 7 July 2026.
Should investors buy MOIL after the Q1 production update?
Ans. This article does not constitute investment advice. Investors should evaluate manganese ore price trends, steel sector demand and valuations, and consult a SEBI registered financial advisor before investing.
