
Commodity Market Update 28 September 2026: Gold Hits Seven-Week Low as Brent Climbs to $107 on Fed Hike Bets and Hormuz Stalemate
- September 28, 2026
- Posted by: Manan Bisht
- Category: News

28 Sep 2026: Spot gold below $4,200 per ounce. Silver near $61.5. Brent about $107, WTI above $93. Natural gas $3.11, down 2.6%. MCX October gold near Rs 1,48,168.
Quick Answer
Today’s commodity market update shows gold and silver under pressure while crude oil climbs. Spot gold slipped below $4,200 per ounce and silver dropped under $62 as US Treasury yields rose and traders priced in more Federal Reserve rate hikes. Brent moved to about $107 a barrel after President Donald Trump rejected Iran’s proposal to reopen the Strait of Hormuz, while natural gas fell 2.6% to $3.11 on profit booking. US inflation and jobs data this week, including core PCE on 30 September and payrolls on 2 October, are the next big triggers.
This commodity market update covers Friday’s close and Monday’s session for gold, silver, crude oil, natural gas and base metals. Precious metals had a rough start to the week, while energy prices reacted to weekend headlines from Washington and Tehran.
Each section of this commodity market update pairs the latest price action with the support and resistance levels traders are tracking on international charts and MCX contracts. It then lays out the US data calendar and the news flow that could move commodity prices today and through the rest of the week.
Click Here – Get Free Investment Predictions
Commodity Market Update: How Gold, Silver, Crude and Gas Moved on Friday and Monday
Gold, silver, copper and natural gas fell on Monday, 28 September, while Brent and WTI crude oil rose. The split has one root: the same oil rally that is lifting energy prices is pushing up inflation fears, Treasury yields and rate-hike bets, and that combination hurts metals that pay no yield.
| Commodity | Latest level, 28 Sep | Move on the day | What is driving it |
|---|---|---|---|
| Spot gold | Below $4,200 per ounce | Down about 2.5% | Seven-week low on US yields and Fed hike bets |
| Spot silver | Near $61.5 per ounce | Down about 4.2% | Rate pressure plus weaker industrial demand outlook |
| Brent crude | About $107 per barrel | Up 2.5% to 2.9% | Trump rejects Iran’s Hormuz proposal |
| WTI crude | Above $93 per barrel | Up around 1.8% | Supply risk, though diesel export ban talk caps gains |
| Natural gas | $3.11 per mmBtu | Down 2.6% | Profit booking after a 13-week high |
| LME copper | Around $14,470 per tonne | Lower | Soft China demand outlook and a firm dollar |
| MCX October gold | Rs 1,48,168 per 10 grams | Down about 1.8% | Follows global gold, cushioned by a weak rupee |
| MCX December silver | Rs 2,29,000 per kg | Down about 2.6% | Follows global silver lower |
| MCX October crude oil | Rs 9,051 per barrel | Tracks global crude higher | Brent above $100 and rupee near 96.2 |
Friday set the tone for the week’s commodity market. WTI ended the week nearly 8% lower on hopes of a phased reopening of the Strait of Hormuz, but those hopes faded over the weekend, and the reversal shows up in Monday’s numbers.
Gold Price Today: Why Is Gold Falling Even as Geopolitical Risk Rises?
Gold is falling because the war is pushing oil higher, and higher oil is feeding inflation fears and expectations of more Federal Reserve rate hikes. A US 10-year Treasury yield above 5.2% raises the cost of holding a metal that pays no interest, and a firm dollar adds to the pressure.
Spot gold traded around $4,270 to $4,285 on Friday, and Comex December futures settled at $4,321.20, up 0.54%, after Thursday’s move took 10-year and 30-year Treasury yields to their highest levels since 2007 and 2004. On Monday, gold broke below $4,200 per ounce and touched a seven-week low, losing about 2.5% on the day.
The Federal Reserve raised rates on 16 September for the first time since 2023, lifting the target range to 3.75% to 4.00% in a unanimous vote. Market pricing now points to roughly a 70% chance of another hike at the 27 to 28 October meeting. Cleveland Fed President Beth Hammack said on Friday that the rise in long-term yields reflects a jump in real rates more than higher inflation expectations.
Longer-term support has not disappeared. Central banks bought a record 289 tonnes of gold in the second quarter, while Western gold ETFs saw net outflows of around 45 tonnes, a split that shows official buyers stepping in as investors sell. Even so, gold sits roughly a quarter below its January record above $5,500, so the rate outlook decides the next leg.
On MCX, the October gold contract fell about Rs 2,700, or 1.8%, to around Rs 1,48,100 per 10 grams, slipping below Rs 1.50 lakh. A weaker rupee, near 96.2 per dollar, softens the fall in domestic prices compared with the 2.5% drop in dollar terms. Readers tracking this commodity market update on MCX should note that the October contract is due to expire on 5 October, so volumes typically shift toward the December contract.
Gold Price Today: Technical View and Key Levels
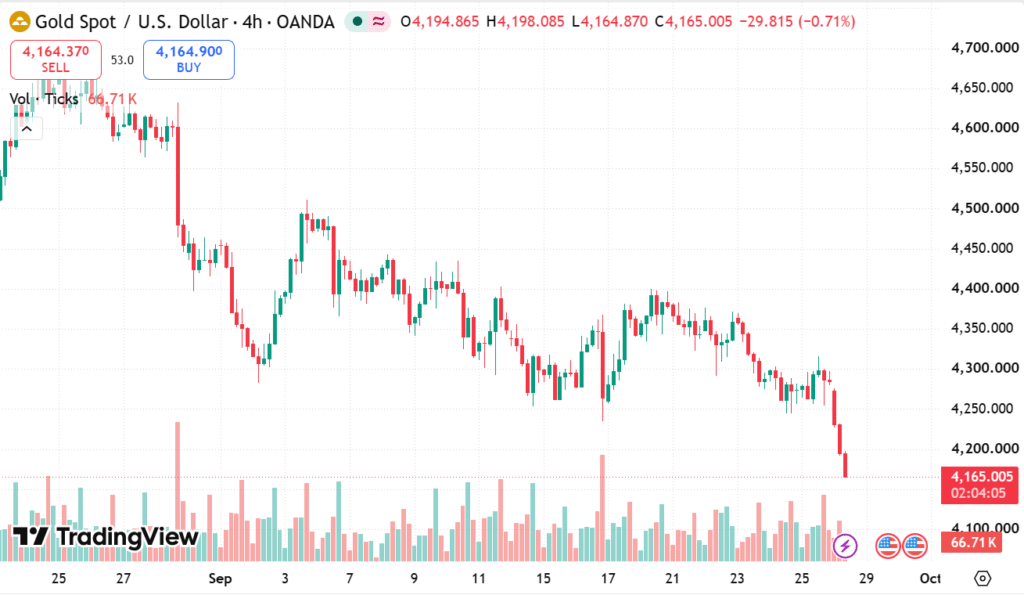
Spot gold is sitting on its first support at $4,165, and a close below it would open the way to $4,146 and $4,082. The 4-hour chart shows a run of lower highs since the early-September peak near $4,500, and Monday’s drop cleared the mid-September swing low around $4,235.
| Contract (Spot in $ per ounce, MCX in Rs) | Support 3 | Support 2 | Support 1 | Reference price | Resistance 1 | Resistance 2 | Resistance 3 |
|---|---|---|---|---|---|---|---|
| Spot gold ($/oz) | 4,082 | 4,146 | 4,165 | 4,197 | 4,229 | 4,248 | 4,312 |
| MCX Gold Oct (Rs/10 g) | 1,45,119 | 1,46,804 | 1,47,325 | 1,48,168 | 1,49,011 | 1,49,532 | 1,51,218 |
| MCX Gold Dec (Rs/10 g) | 1,47,616 | 1,49,248 | 1,49,752 | 1,50,568 | 1,51,384 | 1,51,888 | 1,53,520 |
In this commodity market update, a recovery above $4,248 would be the first sign that selling pressure is easing, and $4,312 marks the next hurdle. On MCX October gold, Rs 1,47,325 is the level to watch on the downside, with Rs 1,49,011 as the first resistance.
Silver Price Today: Sharper Fall Than Gold as Industrial Worries Add to Rate Pressure
Silver price today is around $61.5 per ounce, down about 4.2% after trading near $64 on Friday.
Silver is the weakest link in today’s commodity market update because it carries industrial demand risk on top of the rate pressure, so it fell almost twice as hard as gold. Softer expectations for Chinese demand and a stronger dollar hurt industrial metals broadly, and silver sits in both the precious and industrial camps. The gold-silver ratio is near 67.8, and silver trades at roughly half its January record above $120.
On MCX, December silver dropped about Rs 6,100, or 2.6%, to around Rs 2,29,000 per kg.
Silver Technical View: Support and Resistance Levels
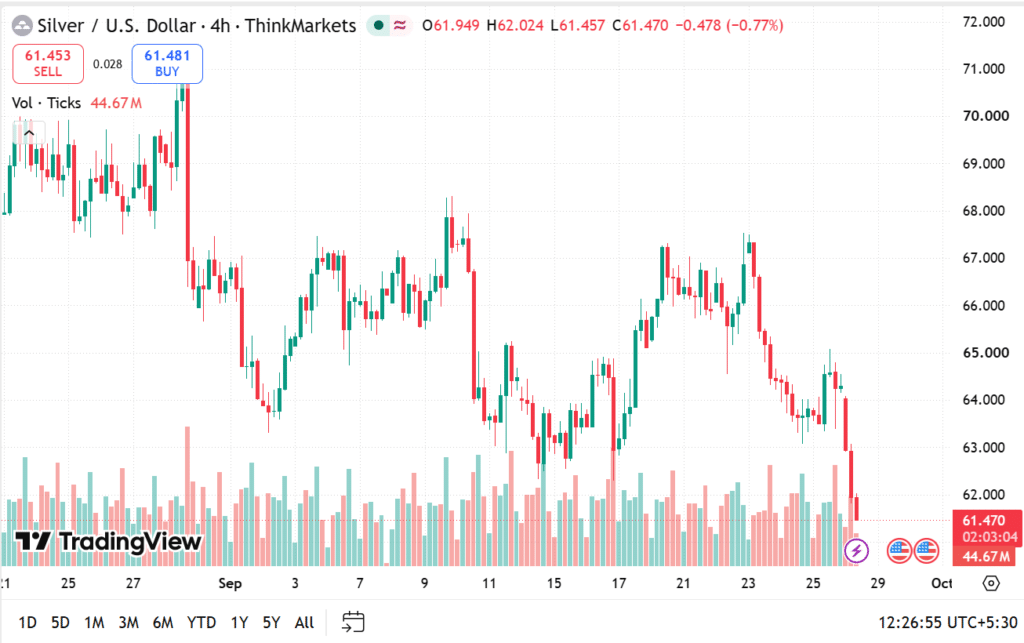
The 4-hour chart shows silver failing near $67.5 on 23 September and then sliding through the mid-September low around $62.3. Spot silver has little room above $61.15 before $60.60 and $58.85 come into view.
| Contract (Spot in $ per ounce, MCX in Rs) | Support 3 | Support 2 | Support 1 | Reference price | Resistance 1 | Resistance 2 | Resistance 3 |
|---|---|---|---|---|---|---|---|
| Spot silver ($/oz) | 58.85 | 60.60 | 61.15 | 62.05 | 62.90 | 63.45 | 65.20 |
| MCX Silver Dec (Rs/kg) | 2,21,426 | 2,25,613 | 2,26,906 | 2,29,000 | 2,31,094 | 2,32,387 | 2,36,574 |
| MCX Silver Mini Nov (Rs/kg) | 2,23,872 | 2,27,919 | 2,29,169 | 2,31,192 | 2,33,215 | 2,34,465 | 2,38,512 |
For the commodity market update to turn constructive on silver, the metal needs to clear $62.90 and then $63.45. Until then, rallies toward those levels are more likely to meet selling than fresh buying.
Crude Oil Price Today: Brent Near $107 as Hormuz Deal Talks Stall
Crude oil price today is firmer, with Brent up 2.5% to 2.9% at about $107 a barrel and WTI up around 1.8% above $93, after President Donald Trump rejected Iran’s proposal to reopen the Strait of Hormuz.
WTI settled at $92.41 on Friday, down 2.3% on the day and almost 8% on the week, its first weekly fall since late August, as reports of a phased reopening of Hormuz lifted hopes of a deal. Brent finished the day near $104.3.
Over the weekend, Iran’s foreign minister offered to reopen the strait within seven days if the US lifts its naval blockade, unfreezes Iranian assets and ends the war on all fronts. Trump rejected the offer on Saturday, and Tehran said it will not soften its conditions. Trump has also said he expects talks to resume this week, which keeps the risk of a sharp reversal in prices alive.
The risk highlighted in this commodity market update is physical, not just headline-driven. Tanker-tracking data show 33.7 million barrels moved through Hormuz in the week from 20 September, down from 49.2 million barrels the week before. Houthi missile attacks on Saudi Arabia on Thursday pushed Brent as high as $108.23 intraday before it settled near $106.60.
The Brent-WTI spread has widened to around $12 a barrel, the largest since May, partly because of talk of a US diesel export ban. Supply data add another layer. US commercial crude inventories rose 3.0 million barrels to 426.4 million barrels in the week ended 18 September, about 2% above the five-year average, and production held near a record 13.94 million barrels per day. The US rig count rose to 599, including 455 oil rigs, the highest total since May 2024.
OPEC+ kept October output policy unchanged and meets again on 4 October. On MCX, October crude oil trades around Rs 9,051 per barrel, and with the rupee near 96.2 per dollar and Brent above $100, India’s crude import bill rises on both counts.
Crude Oil Technical View: Support and Resistance Levels
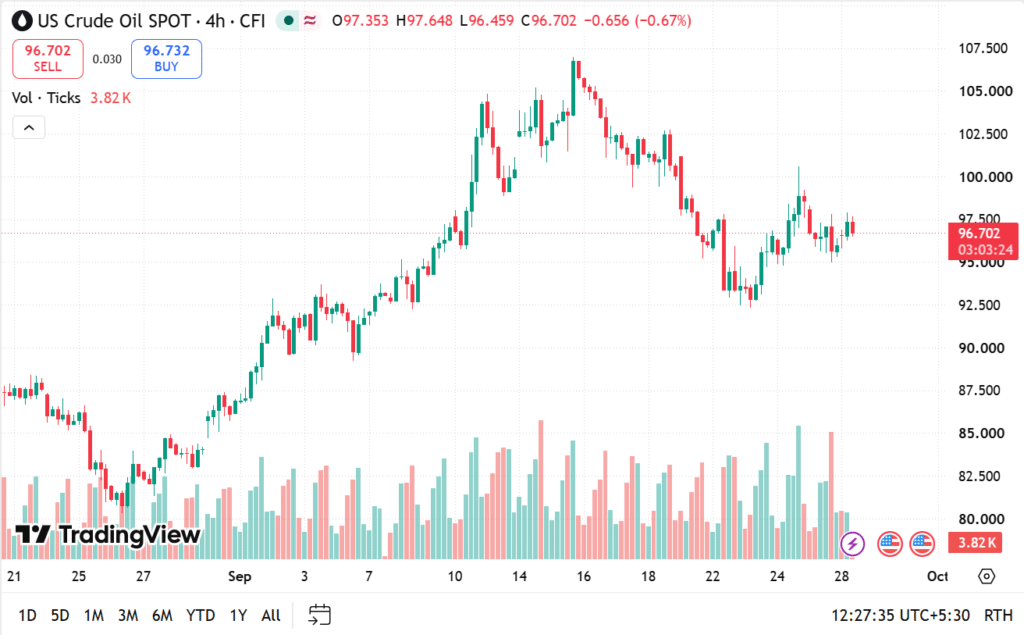
The US crude spot chart shows a rally from the low $80s in late August to a peak above $106 in mid-September, a drop to about $92.5 on 22 to 23 September, and a rebound to $100 before prices settled into a $95 to $98 range. Spot chart quotes can sit a few dollars above front-month futures, so use the MCX levels below for contract-specific planning.
| Contract (MCX, Rs per barrel) | Support 3 | Support 2 | Support 1 | Reference price | Resistance 1 | Resistance 2 | Resistance 3 |
|---|---|---|---|---|---|---|---|
| MCX Crude Oil Oct | 8,513 | 8,810 | 8,902 | 9,051 | 9,200 | 9,292 | 9,589 |
| MCX Crude Oil Nov | 8,250 | 8,500 | 8,577 | 8,702 | 8,827 | 8,904 | 9,154 |
A move above Rs 9,200 on October crude would put Rs 9,292 and Rs 9,589 in play, while a break under Rs 8,902 exposes Rs 8,810. Because oil is trading on headlines, both a deal announcement and a fresh attack can push prices through these levels within hours, which is why this commodity market update treats them as reference zones rather than firm floors.
Natural Gas Price Today: Profit Booking After a 13-Week High
Natural gas price today is $3.11 per mmBtu, down 2.6%, as traders booked profits after Henry Hub futures hit a 13-week high on Thursday, 24 September, the highest level since 8 July.
Thursday’s surge, the biggest one-day gain since January, followed a force majeure declared on a Columbia Gas Transmission pipeline in Appalachia, which took around 1.8 million dekatherms a day of firm capacity offline. Prices gave back part of that gain on Friday and again on Monday.
Support from LNG demand remains. Feedgas to the nine major US export plants averaged 17.8 billion cubic feet per day in September, up from 17.2 in August, even with the Cove Point plant in maintenance. The latest storage build of 53 Bcf was below the 77 Bcf a year earlier and the 76 Bcf five-year average, trimming the surplus to 95 Bcf, or 2.9%, from 118 Bcf.
Against that, output near 112.8 billion cubic feet per day is close to record levels, and forecasts show mostly normal weather into early October, which limits heating and cooling demand. The next storage report is due on Thursday, 1 October. On MCX, October natural gas trades around Rs 300.60 per mmBtu after touching Rs 318.50 last week, while the November contract at Rs 333.70 reflects the winter premium.
Natural Gas Technical View: Support and Resistance Levels
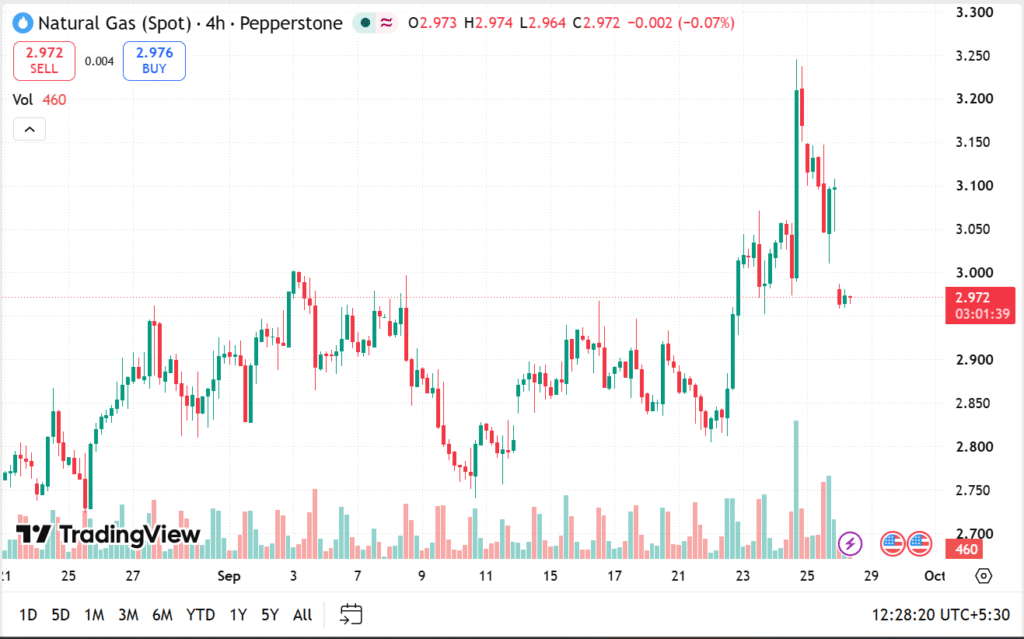
The spot chart shows gas climbing from about $2.85 on 22 September to a peak near $3.25 before retreating toward $2.97, just under the $3.00 mark.
| Contract (MCX, Rs per mmBtu) | Support 3 | Support 2 | Support 1 | Reference price | Resistance 1 | Resistance 2 | Resistance 3 |
|---|---|---|---|---|---|---|---|
| MCX Natural Gas Oct | 283.00 | 292.70 | 295.70 | 300.60 | 305.50 | 308.50 | 318.20 |
| MCX Natural Gas Nov | 317.50 | 326.40 | 329.20 | 333.70 | 338.20 | 340.95 | 349.95 |
The natural gas leg of this commodity market update is range-bound: October natural gas needs to hold Rs 295.70, and a break exposes Rs 292.70 and Rs 283.00. On the upside, Rs 305.50 is the first resistance, followed by Rs 308.50.
Base Metals: Copper Slips on China Demand Worries
The base metals leg of this commodity market update is weak: LME base metals fell across the board on Monday, led by copper near $14,470 per tonne. China’s industrial profits rose 4.2% in August from a year earlier, slowing from 11.2% in July, and the data reinforced worries about demand for industrial commodities. A stronger dollar and rate fears added pressure, and traders stayed cautious ahead of China’s Golden Week holiday from 1 to 7 October.
Comex copper fell about 1.6% to around $6.59 per pound after nearing a record of $6.80 on 8 September. Supply remains tight after the Democratic Republic of Congo banned copper and cobalt concentrate exports from 6 August. On MCX, October copper trades around Rs 1,407 per kg, with support at Rs 1,402 and Rs 1,398 and resistance at Rs 1,413 and Rs 1,416.
Commodity Market Update: Latest News Moving Prices
Trump Weighs a US Diesel Export Ban
Trump said on Sunday, 27 September, that he is considering a diesel export ban “very seriously” and could implement it, though it may nudge gasoline prices up. Officials including the National Economic Council director, the Treasury Secretary and the US Trade Representative have reportedly been analysing a short-term ban.
A ban would keep distillate supply inside the US, which is why WTI has lagged Brent. It would weigh on US crude relative to Brent, support global diesel margins and could raise US gasoline prices because refiners produce both fuels together. Oil executives reportedly prefer suspending the federal diesel excise tax instead, and several economists have warned against a ban.
US Consumer Confidence Weakens as Inflation Expectations Rise
The University of Michigan consumer sentiment index fell 7% in September to 48.1, and it is 12.7% below a year ago. The current conditions gauge slipped 1.9% to 50.9, while the expectations index dropped 10.1% to 46.3.
One-year inflation expectations rose to 4.6% from 4.0%, the highest since June and well above the 3.4% recorded in February, while long-term expectations edged up to 3.4% from 3.3%. For this commodity market update, the takeaway is that rising inflation expectations strengthen the case for further Fed tightening, the main headwind for gold and silver.
US Durable Goods Orders Hold Steady
Durable goods orders were little changed in August, slipping $0.1 billion to $338.6 billion after a 0.9% rise in July. Transportation orders fell 0.6%, while orders excluding transportation rose 0.3%, and core capital goods orders rose 1.6%, well above the 0.5% forecast. The data point to weaker consumers alongside resilient business investment, a mixed signal for monetary policy.
US Data and Events That Could Move Commodities This Week
US macro data dominates the week, and the releases below will shape the dollar, Treasury yields, Fed expectations and commodity volatility.
| Date | Event | What to watch |
|---|---|---|
| Tue, 29 Sep | US JOLTS job openings; Conference Board consumer confidence | Economists expect around 7.2 million openings and confidence near 90 |
| Wed, 30 Sep | US August PCE inflation; Q2 GDP third estimate; ADP employment; US crude inventories | Core PCE expected at +0.3% for the month and 3.3% on the year; headline near 3.7% |
| Thu, 1 Oct | ISM manufacturing PMI; jobless claims; US natural gas storage | ISM forecast near 55.0 against 54.6 previously |
| Fri, 2 Oct | September non-farm payrolls and unemployment rate | Economists expect around 100,000 jobs and unemployment at 4.1%, against 162,000 jobs previously |
| Sun, 4 Oct | OPEC+ monthly meeting | Output policy for the next month |
| 5 to 7 Oct | RBI monetary policy committee meeting | Rate decision and rupee commentary |
Annual revisions to the inflation data could distort year-on-year comparisons on Wednesday, so the month-on-month reading matters more. A hot core PCE print or a payrolls beat would likely push yields and the dollar higher and add pressure on gold and silver, while a soft reading could give bullion a relief bounce. Oil traders will watch Wednesday’s inventory data and any resumption of US-Iran talks. Anyone following this commodity market update through the week should treat Wednesday and Friday as the highest-risk sessions.
Screen stocks that move with commodity cycles on the Univest Screener
How Do Support and Resistance Levels Work in Commodity Trading?
Support is a price zone where buying has tended to appear, and resistance is a zone where selling has tended to appear. Traders use these zones to plan entries, exits and stop-loss levels, not to predict exact turning points. That is why every commodity market update, including this one, quotes them alongside price.
- Mark the zones: treat the levels in the tables above as reference zones, not exact prices.
- Wait for confirmation: a close beyond a level, ideally on higher volume, carries more weight than a brief spike.
- Set risk first: place a stop-loss beyond the next support or resistance and size the position so a stop-out costs an amount you can afford.
- Check the calendar: avoid oversized positions into PCE, payrolls or OPEC+ meetings, when levels can break within minutes.
MCX Contract Sizes for Gold, Silver, Crude Oil and Natural Gas
Contract size decides how much each price move is worth, so check it before comparing levels across contracts.
| Contract | Contract size | Price quotation |
|---|---|---|
| Gold | 1 kg | Rs per 10 grams |
| Gold Mini | 100 grams | Rs per 10 grams |
| Silver | 30 kg | Rs per kg |
| Silver Mini | 5 kg | Rs per kg |
| Crude Oil | 100 barrels | Rs per barrel |
| Crude Oil Mini | 10 barrels | Rs per barrel |
| Natural Gas | 1,250 mmBtu | Rs per mmBtu |
| Natural Gas Mini | 250 mmBtu | Rs per mmBtu |
Contract specifications and expiry dates can be revised, so confirm the latest exchange circular before acting on levels from this commodity market update.
Download the Univest iOS App or Univest Android App to track live market updates and get daily stock research.
Commodity Market Outlook: What to Watch After Today’s Moves
The commodity market update for 28 September 2026 comes down to one tension: the war is lifting oil, and oil is feeding the inflation and rate-hike story that is hurting gold and silver. Gold needs to hold $4,165 and silver $61.15 to avoid a slide toward $4,082 and $58.85, while Brent has room toward its $108 intraday high if talks stay frozen.
The picture can flip quickly. A softer core PCE print or a credible Hormuz deal would ease yield pressure on bullion and could pull oil sharply lower, while a hot inflation reading or a fresh attack on Gulf infrastructure would do the opposite. Treat the levels in this article as reference points, size positions with volatility in mind, and consult a SEBI-registered advisor before acting.
Disclaimer: This article is published by Univest (SEBI Registered Research Analyst, Registration No. INH000013776) for general information and educational purposes only. It does not constitute investment advice, a research recommendation, or an offer or solicitation to buy or sell any commodity, derivative or security, and it does not take into account the investment objectives, financial situation or risk appetite of any individual reader.
Prices, percentage moves, technical levels and event dates are indicative, reflect market conditions at the time of writing on 28 September 2026, and can change without notice. Support and resistance levels are analytical reference points, not price targets or trading calls. Figures compiled from publicly available information may contain errors or omissions, so readers should verify all data independently and check live prices before acting.
Trading in commodity futures and options is margin-based and involves a high degree of risk, including the possible loss of more than the initial capital. Commodity prices are affected by geopolitical events, currency movements, interest rates, government policy and supply disruptions that are difficult to forecast. Past performance is not indicative of future results, and no return is assured or guaranteed.
Investments in securities and commodity derivatives are subject to market risks. Please read all related documents carefully and consult a qualified, SEBI registered financial advisor before making any investment or trading decision. Registration with SEBI does not guarantee the performance of the intermediary or assure any returns to investors.
FAQs on Commodity Market Update: Gold, Silver, Crude Oil and Natural Gas
What is today’s commodity market update for gold, silver and crude oil?
Ans. As of 28 September 2026, spot gold is below $4,200 per ounce, silver near $61.5, Brent at about $107 and WTI above $93. Gold and silver fell on rising US yields and Fed hike bets, while crude oil rose after talks on reopening the Strait of Hormuz stalled.
Why is gold falling today?
Ans. Gold is falling today because higher oil prices are feeding inflation fears, which raise bets on more Federal Reserve rate hikes and push the US 10-year Treasury yield above 5.2%. Gold pays no interest, so higher yields and a stronger dollar make it less attractive, even with war-related uncertainty in the background.
What is the MCX gold price today?
Ans. MCX October gold is trading around Rs 1,48,100 to Rs 1,48,200 per 10 grams on 28 September, down about 1.8% on the day. Futures prices differ from jeweller rates, which add GST and making charges, and from international spot prices quoted in dollars per ounce.
What is the silver price today?
Ans. Silver is trading around $61.5 per ounce in the international market, down about 4.2% on the day, while MCX December silver is near Rs 2,29,000 per kg. Spot silver has first support at $61.15 and first resistance at $62.90.
What is the crude oil price today?
Ans. The latest commodity market update puts Brent crude at about $107 per barrel and WTI above $93, both higher on the day, while MCX October crude oil is near Rs 9,051 per barrel. Prices rose after President Trump rejected Iran’s proposal to reopen the Strait of Hormuz.
Why is Brent so much higher than WTI?
Ans. Brent is about $12 a barrel above WTI because supply risks around the Strait of Hormuz are lifting the international benchmark more than the US one. Talk of a US diesel export ban has widened the gap further, as it could keep more fuel supply inside the United States.
What is the natural gas price today?
Ans. Natural gas is trading at $3.11 per mmBtu, down about 2.6% after a 13-week high on 24 September. Strong LNG export demand and a shrinking storage surplus support prices, while near-record production and normal weather limit gains.
Which US data will move commodities this week?
Ans. The main releases for anyone tracking the commodity market update this week are core PCE inflation on 30 September, ISM manufacturing on 1 October and September non-farm payrolls on 2 October. Hot readings would lift yields and the dollar and pressure gold and silver, while soft numbers could support bullion.
