
Alok Industries Ltd. (ALOKINDS): Alok Industries 52 Week Low Streak: Second Straight Session Breakdown Deepens
- September 2, 2026
- Posted by: Harsh Piplani
- Category: News
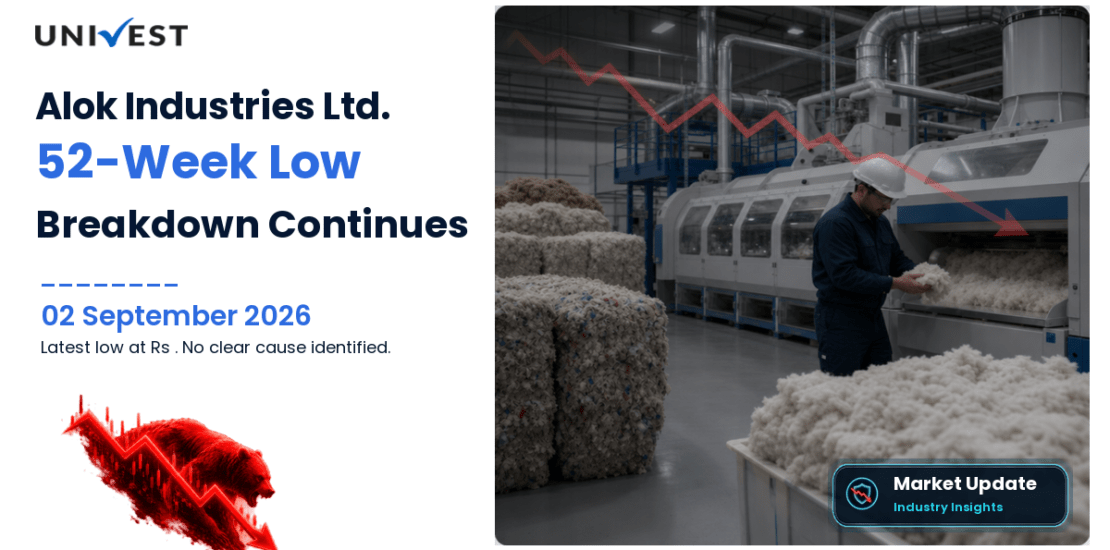
Alok Industries 52 Week Low Streak has now run for its second straight session, with the stock setting another fresh 52-week low and sliding 12.72% across the streak. The latest trough stands at Rs 7.12, while the current price is Rs 7.41. The supplied data confirms the repeated-low pattern, but it does not establish a company-specific cause for the continued decline.
The previous close was Rs 7.69, the stock opened at Rs 7.62 and the day’s high was also Rs 7.62, showing that the session stayed soft from the start. Turnover stood at Rs 1.12 cr and market capitalisation at Rs 4,215.49 cr. For a reader, the key difference versus a single-day breakdown is the persistence: a second straight yearly low suggests the weakness has continued beyond one session and is now a short streak rather than a one-off event.
Alok Industries 52 Week Low Streak: Consecutive Low Analysis
| Metric | Value |
|---|---|
| Current Price | Rs 7.41 |
| Previous Close | Rs 7.69 |
| Today's Move | Rs -0.28 (-3.64%) |
| Open | Rs 7.62 |
| High | Rs 7.62 |
| Low | Rs 7.12 |
| Turnover | Rs 1.12 crore |
| Market Capitalisation | Rs 4,215.49 crore |
Alok Industries Ltd. (ALOKINDS) traded at Rs 7.41. versus the previous close of Rs 7.69, a fall of 3.64%. The stock opened at Rs 7.62, reached Rs 7.62, touched Rs 7.12.
Alok Industries share price today closed at Rs 7.41, down Rs 0.28 or 3.64% from the previous close of Rs 7.69. The stock opened at Rs 7.62 and matched that level as the day’s high before slipping to an intraday low and fresh 52-week trough of Rs 7.12. That means the close sat only slightly above the session low, which keeps the tone of the day clearly weak. The move also matters because this is no longer just a one-session event; it is a repeated Alok Industries 52 Week Low Streak and the price is still trading close to the latest low.
Turnover was Rs 1.12 cr and market capitalisation was Rs 4,215.49 cr. On a pure price basis, the stock remains under pressure after the second straight 52-week low, and the session structure did not show any meaningful recovery from the opening level. For search users tracking Alok Industries Share Price Today, the important fact is that the latest close stayed near the lower end of the day’s range and extended the broader Alok Industries Stock News narrative into another lower low.
What The Repeated 52-Week Lows Show
The core message from this Alok Industries 52 Week Low Streak is persistence. The stock has now set a fresh one-year low for the second straight session, and the cumulative change across that streak is -12.72%. That figure is the most important multi-session statistic because it captures the full decline across the repeated-low pattern, not just the latest daily change. In practical terms, the stock has already moved well below the level that was marked as the 52-week floor on the prior day, and the market has extended that break again.
The supplied data confirms the price pattern but does not explain a company-specific trigger. That distinction matters. A multi-session low streak can be visible in the chart without the inputs here proving any fresh operational development, news event or disclosed catalyst. So the most accurate reading is that the Alok Industries Consecutive 52 Week Low pattern reflects continued downside in the share price itself, while the cause remains unconfirmed in the provided dataset. For readers following Alok Industries New One Year Low moves, the repeated breakdown is the main fact to track.
Alok Industries Ltd. (ALOKINDS) Fundamental Analysis
| Metric | Value |
|---|---|
| Market Capitalisation | Rs 4,215.49 crore |
| P/B Ratio | -0.18x |
| ROE | 0% |
| ROCE | -2.63% |
| EPS | Rs -1.43 |
| Book Value Per Share | Rs -43.64 |
| Dividend Yield | 0% |
Alok Industries Ltd. (ALOKINDS) fundamental metrics show P/B -0.18x, ROE 0%, ROCE -2.63%. These figures provide context only and are not a buy or sell signal.
Alok Industries Ltd. has a market capitalisation of Rs 4215.49 crore, which gives readers a sense of company size before judging valuation. On valuation, P/B at -0.18x should be read against the sector and peer benchmarks rather than as a standalone signal. Profitability is represented by ROE of 0% and ROCE of -2.63%, helping investors compare shareholder returns and capital efficiency. Additional supplied metrics include EPS of Rs -1.43, book value per share of Rs -43.64, dividend yield of 0%, adding context to earnings, balance-sheet value and historical payout. Against the supplied same industry benchmark, these figures can be compared with benchmark median P/E of 16.38x, median ROE of 7.66%, median ROCE of 9.84%. These numbers explain the fundamental backdrop without converting the article into a buy or sell view.
Sector and Industry Context
| Metric | Value |
|---|---|
| Sector | Textile |
| Industry | Textile |
| Benchmark Scope | same industry |
| Benchmark Median P/E | 16.38x |
| Benchmark Average P/E | 70.58x |
| Benchmark P/E Range | 0.68x to 2,175.54x |
| Company P/B Ratio | -0.18x |
| Benchmark Median P/B | 1.17x |
| Company ROE | 0% |
| Benchmark Median ROE | 7.66% |
| Company ROCE | -2.63% |
| Benchmark Median ROCE | 9.84% |
| Company Market Capitalisation | Rs 4,215.49 crore |
| Benchmark Median Market Cap | Rs 95.65 crore |
Alok Industries Ltd. (ALOKINDS) is classified under sector: Textile and industry: Textile.
Alok Industries Ltd. (ALOKINDS) has a ROE of 0%, which is below the benchmark median of 7.66%, a difference of -100%. Alok Industries Ltd. (ALOKINDS) has a ROCE of -2.63%, which is below the benchmark median of 9.84%, a difference of -126.73%.
Track stocks falling to yearly lows through the Univest 52-week-low screener. The peer table below provides the company-level comparison.
Peer Comparison
| Company | Symbol | Market Cap (Cr) | P/E | P/B | ROE (%) | ROCE (%) |
|---|---|---|---|---|---|---|
| Raymond Lifestyle Ltd. | RAYMONDLSL | 4,047.16 | 89.49 | 0.41 | 0.48 | 2.95 |
| Jindal Worldwide Ltd. | JINDWORLD | 3,843.98 | 49.75 | 4.74 | 8.46 | 8.94 |
| Lux Industries Ltd. | LUXIND | 3,637.32 | 35.08 | 1.93 | 9.98 | 12.8 |
| Kewal Kiran Clothing Ltd. | KKCL | 3,113.61 | 21.16 | 3.26 | 19.95 | 25.87 |
| Gokaldas Exports Ltd. | GOKEX | 5,720.42 | 55.7 | 2.6 | 9.72 | 12.75 |
Its ROE of 0% compares with a peer median of 9.72% across the companies shown in the table. ROCE stood at -2.63% versus the displayed peer median of 12.75%, providing a capital-efficiency comparison. Alok Industries Ltd. (ALOKINDS) has a market capitalisation of Rs 4,215.49 crore. Among the 5 peers shown, 1 have a larger market capitalisation.
Why Investors Are Watching
- The Alok Industries 52 Week Low Streak has extended to a second straight session, keeping attention on the repeated breakdown pattern.
- The stock has moved 12.72% across the streak, which is the key cumulative figure for this event.
- The latest low at Rs 7.12 sets the current one-year trough and defines the latest reference point for the trend.
- Fundamental metrics in the supplied data remain weak, including negative P/B, negative ROCE and negative EPS.
- Investors tracking Alok Industries Stock News may watch whether the next session confirms or breaks the pattern of fresh yearly lows.
About The Company
Alok Industries Ltd. is a listed textile company traded on NSE and BSE under the symbol ALOKINDS. The business sits in the Textile sector and industry, and its current market capitalisation in the supplied data is Rs 4,215.49 cr. For readers scanning Alok Industries Company News or Alok Industries Stock Performance, the main point is that this is a large listed textile name whose share price is currently making repeated one-year lows.
Because the event is a fresh 52-week low, the focus stays on the stock’s recent price path rather than on any long-term record-low claim. The current article should therefore be read as a streak update on Alok Industries 52 Week Low Streak, not as an all-time-low statement. That keeps the interpretation tied strictly to the supplied data and the latest market session.
Track Alok Industries on Univest
Track the latest Alok Industries 52 Week Low Streak, share price movement, and stock news on Univest for ongoing updates. Readers following Alok Industries Share Price Today can use the company page to monitor the next session, compare the latest price with the current one-year low, and review how the broader textile context evolves.
Frequently Asked Questions
What does Alok Industries 52 Week Low Streak mean?
Ans. It means Alok Industries has set a fresh 52-week low in consecutive sessions. In this case, the streak is at a second straight session, which shows the decline has extended beyond a single-day event.
How many sessions has Alok Industries now set a fresh 52-week low?
Ans. The supplied data shows a fresh 52-week low for the second straight session. That is the streak length currently confirmed for Alok Industries 52 Week Low Streak. The stock moved -3.64% during the session.
What is the latest 52-week low for Alok Industries?
Ans. The latest 52-week low supplied for Alok Industries is Rs 7.12. The stock closed slightly above that level at Rs 7.41 in the latest session. The stock moved -3.64% during the session.
How does Alok Industries compare with textile peers?
Ans. Compared with several textile peers, Alok Industries shows weaker supplied profitability and valuation metrics, including negative P/B, zero ROE and negative ROCE. Several peers in the same list show positive return ratios and positive P/B values.
What should investors monitor next in Alok Industries 52 Week Low Streak?
Ans. Investors can watch whether the next session extends the streak or stabilises above the latest low. The key reference points are the repeated one-year low, the cumulative streak move and any new data that may explain the decline.
Is Alok Industries at an all-time low?
Ans. No such claim is made here. The supplied event is a 52-week low streak, and an all-time-low statement should only be used if that is explicitly supported by the data.
Track Alok Industries Ltd. (ALOKINDS) Share Price on Univest
Use Univest 52-week-low screener, Univest market blogs to review live stock data, yearly-low lists and related market analysis.
